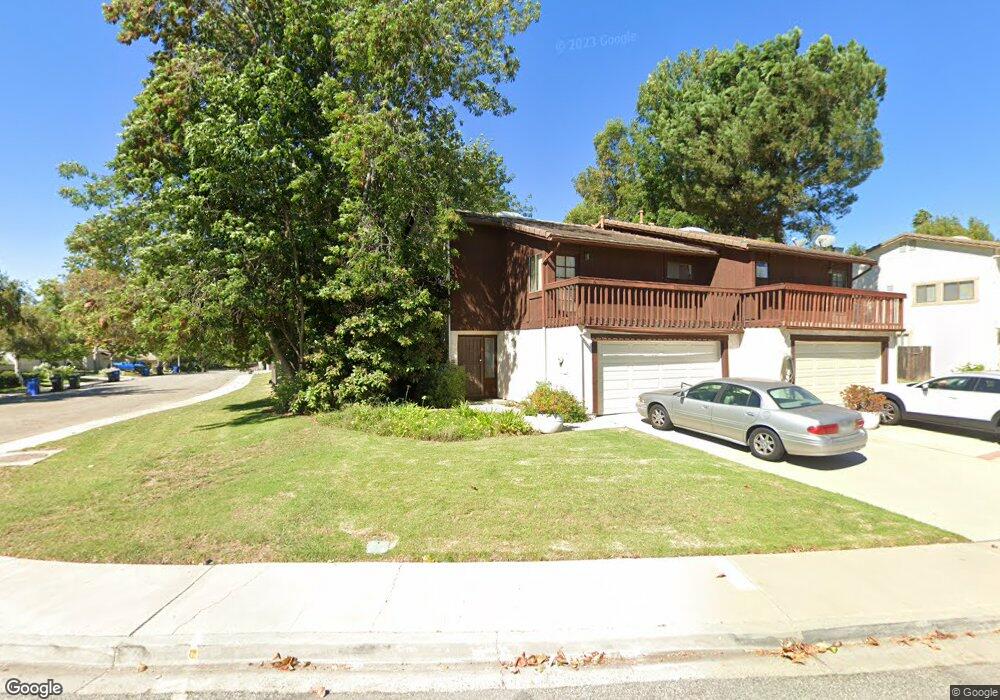
2611 Calle Abedul Unit 2617 Thousand Oaks, CA 91360
Estimated Value: $1,273,000 - $1,484,000
--
Bed
--
Bath
3,933
Sq Ft
$355/Sq Ft
Est. Value
About This Home
This home is located at 2611 Calle Abedul Unit 2617, Thousand Oaks, CA 91360 and is currently estimated at $1,395,130, approximately $354 per square foot. 2611 Calle Abedul Unit 2617 is a home located in Ventura County with nearby schools including Weathersfield Elementary School, Los Cerritos Middle School, and Thousand Oaks High School.
Ownership History
Date
Name
Owned For
Owner Type
Purchase Details
Closed on
Jul 30, 2012
Sold by
George Austin J and George Elaine L
Bought by
George Austin J and George Elaine L
Current Estimated Value
Purchase Details
Closed on
Jul 28, 2004
Sold by
Keena Lynda
Bought by
Revocab Austin J and Revocab Elaine L George Joint
Purchase Details
Closed on
Jul 25, 2004
Sold by
Keena Paul
Bought by
Keena Lynda
Purchase Details
Closed on
Jul 9, 2004
Sold by
George Austin J and George Elaine L
Bought by
George Austin J and George Elaine L
Purchase Details
Closed on
Apr 30, 2003
Sold by
George Austin J and George Elaine L
Bought by
George Austin J and George Elaine L
Home Financials for this Owner
Home Financials are based on the most recent Mortgage that was taken out on this home.
Original Mortgage
$165,000
Interest Rate
5.84%
Create a Home Valuation Report for This Property
The Home Valuation Report is an in-depth analysis detailing your home's value as well as a comparison with similar homes in the area
Home Values in the Area
Average Home Value in this Area
Purchase History
| Date | Buyer | Sale Price | Title Company |
|---|---|---|---|
| George Austin J | -- | None Available | |
| George Austin J | -- | None Available | |
| Revocab Austin J | -- | -- | |
| Keena Lynda | -- | -- | |
| George Austin J | -- | -- | |
| George Austin J | -- | Commonwealth Land Title Co |
Source: Public Records
Mortgage History
| Date | Status | Borrower | Loan Amount |
|---|---|---|---|
| Previous Owner | George Austin J | $165,000 |
Source: Public Records
Tax History Compared to Growth
Tax History
| Year | Tax Paid | Tax Assessment Tax Assessment Total Assessment is a certain percentage of the fair market value that is determined by local assessors to be the total taxable value of land and additions on the property. | Land | Improvement |
|---|---|---|---|---|
| 2025 | $6,485 | $618,892 | $208,023 | $410,869 |
| 2024 | $6,485 | $606,757 | $203,944 | $402,813 |
| 2023 | $6,324 | $594,860 | $199,945 | $394,915 |
| 2022 | $6,145 | $583,197 | $196,025 | $387,172 |
| 2021 | $6,044 | $571,762 | $192,181 | $379,581 |
| 2020 | $5,967 | $565,901 | $190,211 | $375,690 |
| 2019 | $5,808 | $554,806 | $186,482 | $368,324 |
| 2018 | $5,692 | $543,928 | $182,826 | $361,102 |
| 2017 | $5,581 | $533,264 | $179,242 | $354,022 |
| 2016 | $5,528 | $522,809 | $175,728 | $347,081 |
| 2015 | $5,431 | $514,958 | $173,090 | $341,868 |
| 2014 | $5,353 | $504,872 | $169,700 | $335,172 |
Source: Public Records
Map
Nearby Homes
- 731 Calle Nogal
- 2660 Calle Abedul
- 650 Calle Pensamiento
- 970 Calle Nogal
- 823 Calle Margarita
- 2947 Camino Del Zuro
- 2340 Aldrich Cir
- 960 Calle Margarita
- 1322 E Avenida de Los Arboles
- 416 Camino Dos Palos
- 2219 Goldsmith Ave
- 2651 Sirius St
- 1233 Calle Pensamiento
- 914 Calle Jazmin
- 71 Del Ray Cir
- 417 Kevin St
- 1356 Calle Crisantemo
- 205 Larkhill St
- 1373 Calle Crisantemo
- 2965 Dogwood Cir
- 2629 Calle Abedul
- 2635 Calle Abedul
- 651 Calle Del Sur
- 2600 Calle Abedul Unit 35
- 2600 Calle Abedul
- 643 Calle Del Sur
- 2610 Calle Elegante
- 2612 Calle Abedul
- 2641 Calle Abedul Unit 2
- 2641 Calle Abedul
- 2647 Calle Abedul
- 2628 Calle Abedul
- 2609 Calle Elegante
- 2608 Calle Elegante Unit 44
- 635 Calle Del Sur
- 2594 Calle Abedul
- 2606 Calle Elegante
- 2614 Calle Abedul
- 2586 Calle Abedul
- 2646 Calle Abedul