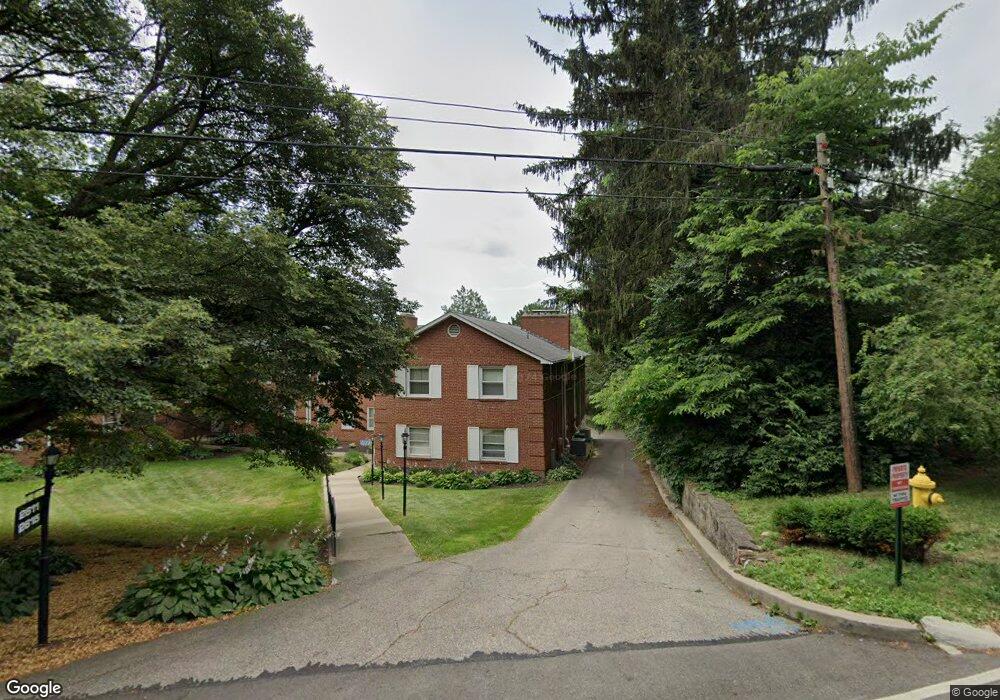
2611 Charing Rd Unit 2611B Columbus, OH 43221
Estimated Value: $223,907 - $240,000
2
Beds
2
Baths
950
Sq Ft
$244/Sq Ft
Est. Value
About This Home
This home is located at 2611 Charing Rd Unit 2611B, Columbus, OH 43221 and is currently estimated at $232,227, approximately $244 per square foot. 2611 Charing Rd Unit 2611B is a home located in Franklin County with nearby schools including Tremont Elementary School, Jones Middle School, and Upper Arlington High School.
Ownership History
Date
Name
Owned For
Owner Type
Purchase Details
Closed on
May 17, 2024
Sold by
Bragg Cheri L
Bought by
Shah Rushil and Shah Amar
Current Estimated Value
Home Financials for this Owner
Home Financials are based on the most recent Mortgage that was taken out on this home.
Original Mortgage
$213,750
Outstanding Balance
$210,718
Interest Rate
6.82%
Mortgage Type
Credit Line Revolving
Estimated Equity
$21,509
Purchase Details
Closed on
Apr 30, 2024
Sold by
Bragg Cheri L
Bought by
Shah Rushil and Shah Amar
Home Financials for this Owner
Home Financials are based on the most recent Mortgage that was taken out on this home.
Original Mortgage
$213,750
Outstanding Balance
$210,718
Interest Rate
6.82%
Mortgage Type
Credit Line Revolving
Estimated Equity
$21,509
Purchase Details
Closed on
Aug 3, 2018
Sold by
Roberts Christopher A
Bought by
Bragg Cheri L
Home Financials for this Owner
Home Financials are based on the most recent Mortgage that was taken out on this home.
Original Mortgage
$54,900
Interest Rate
4.5%
Mortgage Type
New Conventional
Purchase Details
Closed on
Sep 26, 2016
Sold by
Elif Uysal
Bought by
Roberts Christopher
Home Financials for this Owner
Home Financials are based on the most recent Mortgage that was taken out on this home.
Original Mortgage
$104,000
Interest Rate
3.48%
Purchase Details
Closed on
Jun 10, 2016
Sold by
Uysal Elif
Bought by
Roberts Christopher A
Purchase Details
Closed on
Jul 11, 2014
Sold by
Carothers Sarah C
Bought by
Uysal Elif
Purchase Details
Closed on
Mar 16, 2009
Sold by
Bazella Corrine and Schroer Brian
Bought by
Carothers Sarah C
Home Financials for this Owner
Home Financials are based on the most recent Mortgage that was taken out on this home.
Original Mortgage
$96,540
Interest Rate
5.22%
Mortgage Type
Unknown
Purchase Details
Closed on
May 26, 2004
Sold by
Kerr Durbin W and Kerr Mary E
Bought by
Bazella Corinne
Home Financials for this Owner
Home Financials are based on the most recent Mortgage that was taken out on this home.
Original Mortgage
$92,000
Interest Rate
4.62%
Mortgage Type
Purchase Money Mortgage
Purchase Details
Closed on
Mar 13, 1999
Sold by
Kanna Vani and Ott Vani K
Bought by
Kerr Durbin W and Kerr Mary E
Home Financials for this Owner
Home Financials are based on the most recent Mortgage that was taken out on this home.
Original Mortgage
$76,740
Interest Rate
7.17%
Mortgage Type
FHA
Purchase Details
Closed on
Feb 2, 1996
Sold by
Miller Janet S
Bought by
Kanna Vani
Home Financials for this Owner
Home Financials are based on the most recent Mortgage that was taken out on this home.
Original Mortgage
$68,400
Interest Rate
7.24%
Mortgage Type
New Conventional
Purchase Details
Closed on
Jan 28, 1993
Purchase Details
Closed on
Oct 1, 1985
Create a Home Valuation Report for This Property
The Home Valuation Report is an in-depth analysis detailing your home's value as well as a comparison with similar homes in the area
Home Values in the Area
Average Home Value in this Area
Purchase History
| Date | Buyer | Sale Price | Title Company |
|---|---|---|---|
| Shah Rushil | $225,000 | Title Connect Agency | |
| Shah Rushil | $225,000 | Title Connect Agency | |
| Bragg Cheri L | $154,900 | None Available | |
| Roberts Christopher | -- | -- | |
| Roberts Christopher A | $130,000 | None Available | |
| Uysal Elif | $104,900 | Land Sel Title | |
| Carothers Sarah C | $120,700 | Talon Group | |
| Bazella Corinne | $115,000 | -- | |
| Kerr Durbin W | $79,200 | Chicago Title | |
| Kanna Vani | $72,000 | -- | |
| -- | $61,000 | -- | |
| -- | $54,900 | -- |
Source: Public Records
Mortgage History
| Date | Status | Borrower | Loan Amount |
|---|---|---|---|
| Open | Shah Rushil | $213,750 | |
| Closed | Shah Rushil | $213,750 | |
| Previous Owner | Bragg Cheri L | $54,900 | |
| Previous Owner | Roberts Christopher | $104,000 | |
| Previous Owner | Roberts Christopher | -- | |
| Previous Owner | Carothers Sarah C | $96,540 | |
| Previous Owner | Bazella Corinne | $92,000 | |
| Previous Owner | Kerr Durbin W | $76,740 | |
| Previous Owner | Kanna Vani | $68,400 |
Source: Public Records
Tax History Compared to Growth
Tax History
| Year | Tax Paid | Tax Assessment Tax Assessment Total Assessment is a certain percentage of the fair market value that is determined by local assessors to be the total taxable value of land and additions on the property. | Land | Improvement |
|---|---|---|---|---|
| 2024 | $3,848 | $66,470 | $14,700 | $51,770 |
| 2023 | $3,800 | $66,465 | $14,700 | $51,765 |
| 2022 | $3,561 | $50,960 | $14,700 | $36,260 |
| 2021 | $3,152 | $50,960 | $14,700 | $36,260 |
| 2020 | $3,124 | $50,960 | $14,700 | $36,260 |
| 2019 | $2,946 | $42,490 | $12,250 | $30,240 |
| 2018 | $2,794 | $42,490 | $12,250 | $30,240 |
| 2017 | $2,793 | $42,490 | $12,250 | $30,240 |
| 2016 | $2,661 | $40,250 | $8,050 | $32,200 |
| 2015 | $2,659 | $40,250 | $8,050 | $32,200 |
| 2014 | $2,662 | $40,250 | $8,050 | $32,200 |
| 2013 | $1,398 | $40,250 | $8,050 | $32,200 |
Source: Public Records
Map
Nearby Homes
- 2594 Scioto View Ln Unit 2594
- The Sierra Plan at Quarry Trails - Single Family Homes
- The Aspen Plan at Quarry Trails - Single Family Homes
- The Whitney Plan at Quarry Trails - Single Family Homes
- 2827 Katmai Dr
- 2835 Katmai Dr
- 2833 Katmai Dr
- 2841 Katmai Dr
- 2792 Kobuk Dr
- 2845 Katmai Dr
- 2800 Kobuk Dr
- 2851 Katmai Dr
- 2806 Kobuk Dr
- 2853 Katmai Dr
- 2812 Kobuk Dr
- 2832 Kobuk Dr
- 2808 Kobuk Dr
- 2872 Kobuk Dr
- 2464 Quarry Trails Dr
- 2878 Kobuk Dr
- 2611 Charing Rd Unit 2611A
- 2611 Charing Rd Unit 2611C
- 2611 Charing Rd Unit 2611D
- 2611 Charing Rd
- 2611 Charing Rd Unit D
- 2611 Charing Rd Unit A
- 2611 Charing Rd Unit B
- 2611 Charing Rd Unit C
- 2615 Charing Rd Unit 2615E
- 2615 Charing Rd Unit 2615B
- 2615 Charing Rd Unit A
- 2615 Charing Rd Unit 2615C
- 2615 Charing Rd
- 2615 Charing Rd Unit 2615F
- 2615 Charing Rd Unit C
- 2615 Charing Rd Unit D
- 2615 Charing Rd Unit F
- 2615 Charing Rd Unit E
- 2609 Charing Rd Unit 2601
- 2601-2609 Charing Rd