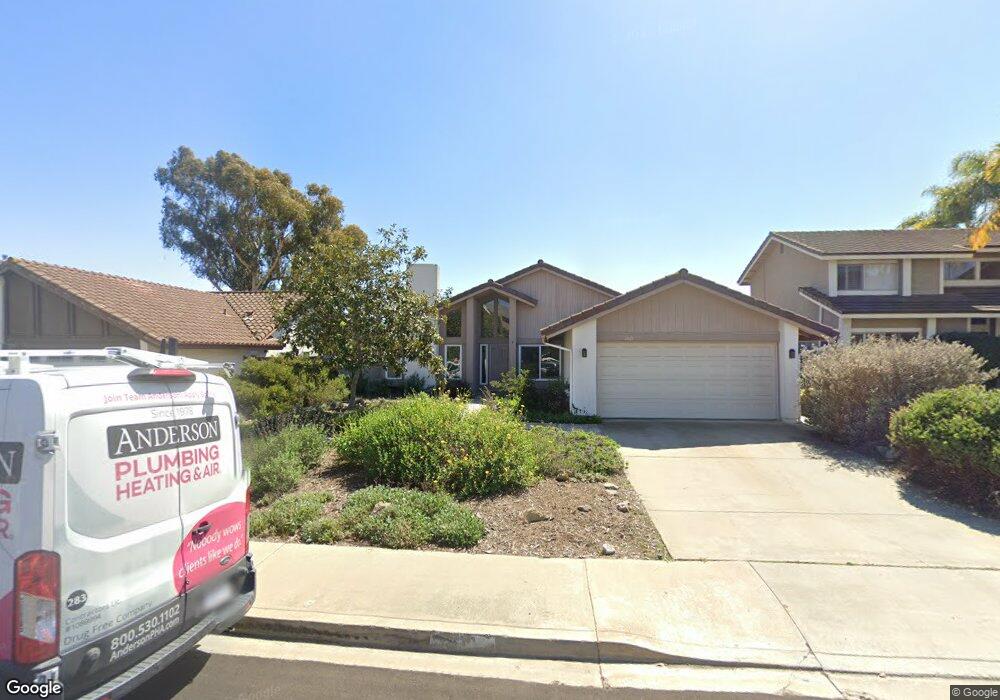
2611 El Rastro Ln Unit 4 Carlsbad, CA 92009
La Costa NeighborhoodEstimated Value: $1,466,665 - $1,582,000
4
Beds
2
Baths
1,620
Sq Ft
$952/Sq Ft
Est. Value
About This Home
This home is located at 2611 El Rastro Ln Unit 4, Carlsbad, CA 92009 and is currently estimated at $1,542,166, approximately $951 per square foot. 2611 El Rastro Ln Unit 4 is a home located in San Diego County with nearby schools including El Camino Creek Elementary School, Oak Crest Middle School, and La Costa Canyon High School.
Ownership History
Date
Name
Owned For
Owner Type
Purchase Details
Closed on
Jul 7, 2003
Sold by
Geertsema Debra Lori
Bought by
Geertsema Roger S
Current Estimated Value
Home Financials for this Owner
Home Financials are based on the most recent Mortgage that was taken out on this home.
Original Mortgage
$408,000
Outstanding Balance
$161,809
Interest Rate
4.37%
Mortgage Type
Unknown
Estimated Equity
$1,380,357
Purchase Details
Closed on
Jun 26, 2003
Sold by
Horton James H and Horton Konnie L
Bought by
Geertsema Roger
Home Financials for this Owner
Home Financials are based on the most recent Mortgage that was taken out on this home.
Original Mortgage
$408,000
Outstanding Balance
$161,809
Interest Rate
4.37%
Mortgage Type
Unknown
Estimated Equity
$1,380,357
Purchase Details
Closed on
Apr 11, 2000
Sold by
Horton James H and Horton Konnie L
Bought by
Horton James H and Horton Konnie L
Create a Home Valuation Report for This Property
The Home Valuation Report is an in-depth analysis detailing your home's value as well as a comparison with similar homes in the area
Home Values in the Area
Average Home Value in this Area
Purchase History
| Date | Buyer | Sale Price | Title Company |
|---|---|---|---|
| Geertsema Roger S | -- | Equity Title Company | |
| Geertsema Roger | $510,000 | Equity Title Company | |
| Horton James H | -- | -- |
Source: Public Records
Mortgage History
| Date | Status | Borrower | Loan Amount |
|---|---|---|---|
| Open | Geertsema Roger | $408,000 |
Source: Public Records
Tax History Compared to Growth
Tax History
| Year | Tax Paid | Tax Assessment Tax Assessment Total Assessment is a certain percentage of the fair market value that is determined by local assessors to be the total taxable value of land and additions on the property. | Land | Improvement |
|---|---|---|---|---|
| 2025 | $8,104 | $725,102 | $504,729 | $220,373 |
| 2024 | $8,104 | $710,885 | $494,833 | $216,052 |
| 2023 | $7,872 | $696,947 | $485,131 | $211,816 |
| 2022 | $7,685 | $683,282 | $475,619 | $207,663 |
| 2021 | $7,556 | $669,886 | $466,294 | $203,592 |
| 2020 | $7,434 | $663,018 | $461,513 | $201,505 |
| 2019 | $7,287 | $650,018 | $452,464 | $197,554 |
| 2018 | $7,162 | $637,274 | $443,593 | $193,681 |
| 2017 | $7,040 | $624,780 | $434,896 | $189,884 |
| 2016 | $6,825 | $612,530 | $426,369 | $186,161 |
| 2015 | $6,703 | $603,330 | $419,965 | $183,365 |
| 2014 | $6,428 | $580,000 | $403,000 | $177,000 |
Source: Public Records
Map
Nearby Homes
- 2702 Jacaranda Ave
- 8008 Avenida Secreto
- 1278 Avenida Miguel
- 7941 Calle Madrid Unit 4
- 8010 Calle Pinon
- 7925 Calle Madrid
- 1633 Willowspring Dr N
- 1931 Avenida Joaquin
- 1981 Avenida Joaquin
- 1848 Wandering Rd
- 721 Summersong Ln
- 3356 Corte Tiburon
- 1655 Splitrail Dr
- 1931 Hummock Ln
- 1519 Valleda Ln
- 3736 38 Via Rancho Michelle
- 658 660 Santa fe Dr
- 772 Conestoga Ct
- 2204 Recodo Ct
- 3101 Levante St
- 2609 El Rastro Ln
- 2613 El Rastro Ln
- 2607 El Rastro Ln
- 2703 El Rastro Ln
- 2618 Jacaranda Ave Unit 4
- 2616 Jacaranda Ave
- 2614 Jacaranda Ave Unit 4
- 2608 El Rastro Ln Unit 4
- 2610 El Rastro Ln
- 2605 El Rastro Ln
- 2704 Jacaranda Ave
- 2705 El Rastro Ln
- 2606 El Rastro Ln
- 2702 El Rastro Ln Unit 4
- 2612 Jacaranda Ave
- 2706 Jacaranda Ave Unit 4
- 7974 La Gacha Ln
- 2603 El Rastro Ln
- 2707 El Rastro Ln
- 2704 El Rastro Ln