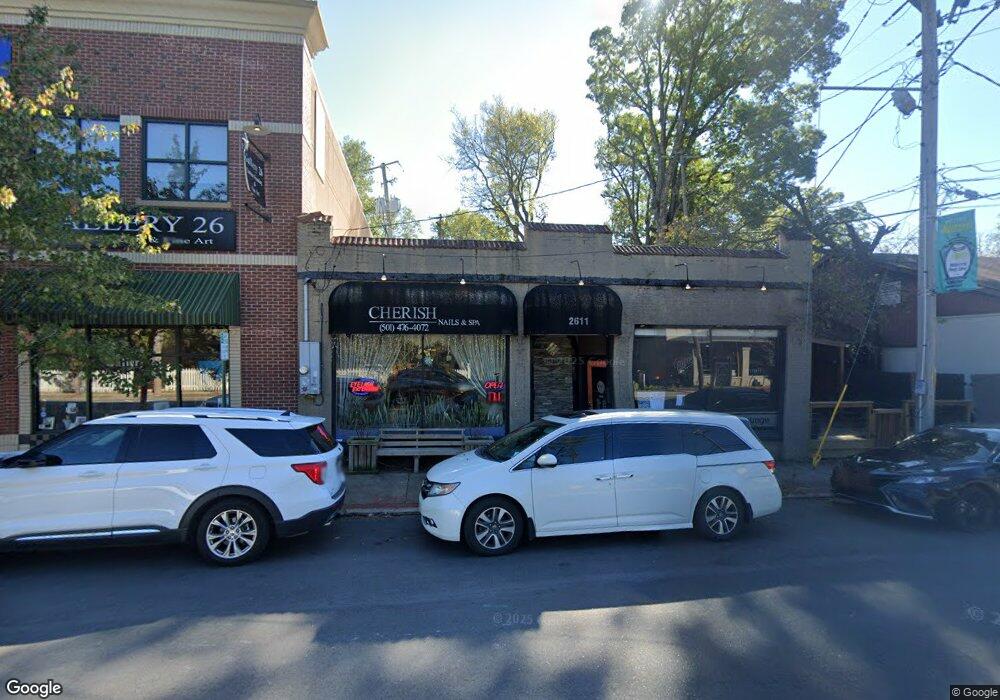
2611 Kavanaugh Blvd Little Rock, AR 72205
Hillcrest NeighborhoodEstimated Value: $915,421
--
Bed
--
Bath
3,397
Sq Ft
$269/Sq Ft
Est. Value
About This Home
This home is located at 2611 Kavanaugh Blvd, Little Rock, AR 72205 and is currently estimated at $915,421, approximately $269 per square foot. 2611 Kavanaugh Blvd is a home located in Pulaski County with nearby schools including Pulaski Heights Elementary School, Pulaski Heights Middle School, and Central High School.
Ownership History
Date
Name
Owned For
Owner Type
Purchase Details
Closed on
Apr 15, 2015
Sold by
2611 Kavanaugh Llc
Bought by
Gdt Properties Llc
Current Estimated Value
Home Financials for this Owner
Home Financials are based on the most recent Mortgage that was taken out on this home.
Original Mortgage
$280,000
Outstanding Balance
$160,639
Interest Rate
3.82%
Mortgage Type
Future Advance Clause Open End Mortgage
Estimated Equity
$754,782
Purchase Details
Closed on
Jan 12, 2015
Sold by
E O Corder Inc and Corder Eddie
Bought by
2611 Kavanaugh Llc
Purchase Details
Closed on
Mar 23, 2001
Sold by
2611 Kavanaugh
Bought by
E O Corder Inc
Home Financials for this Owner
Home Financials are based on the most recent Mortgage that was taken out on this home.
Original Mortgage
$270,000
Interest Rate
6.93%
Mortgage Type
Commercial
Create a Home Valuation Report for This Property
The Home Valuation Report is an in-depth analysis detailing your home's value as well as a comparison with similar homes in the area
Home Values in the Area
Average Home Value in this Area
Purchase History
| Date | Buyer | Sale Price | Title Company |
|---|---|---|---|
| Gdt Properties Llc | $560,000 | None Available | |
| 2611 Kavanaugh Llc | $465,000 | American Abstract & Title Co | |
| E O Corder Inc | $270,000 | American Abstract & Title Co |
Source: Public Records
Mortgage History
| Date | Status | Borrower | Loan Amount |
|---|---|---|---|
| Open | Gdt Properties Llc | $280,000 | |
| Previous Owner | E O Corder Inc | $270,000 |
Source: Public Records
Tax History Compared to Growth
Tax History
| Year | Tax Paid | Tax Assessment Tax Assessment Total Assessment is a certain percentage of the fair market value that is determined by local assessors to be the total taxable value of land and additions on the property. | Land | Improvement |
|---|---|---|---|---|
| 2025 | $7,613 | $108,753 | $34,840 | $73,913 |
| 2024 | $7,613 | $108,753 | $34,840 | $73,913 |
| 2023 | $7,613 | $108,753 | $34,840 | $73,913 |
| 2022 | $7,613 | $108,753 | $34,840 | $73,913 |
| 2021 | $7,121 | $101,010 | $34,840 | $66,170 |
| 2020 | $7,071 | $101,010 | $34,840 | $66,170 |
| 2019 | $7,071 | $101,010 | $34,840 | $66,170 |
| 2018 | $6,861 | $101,010 | $34,840 | $66,170 |
| 2017 | $6,290 | $101,010 | $34,840 | $66,170 |
| 2016 | $5,718 | $81,680 | $17,420 | $64,260 |
| 2015 | $2,748 | $45,741 | $17,420 | $28,321 |
| 2014 | $2,748 | $39,201 | $17,420 | $21,781 |
Source: Public Records
Map
Nearby Homes
- 501 N Palm St
- 326 Ash St
- 314 Rose St
- 304 Walnut St
- 131 Fairview Rd
- 4001 Cedar Hill Rd
- 220 Rose St
- 201 Beechwood St
- 116 Beechwood St
- 4819 Lee Ave
- 4213 A St
- 1100 N Palm St
- 416 N Spruce St
- 621 N Pine St
- 3901 Cedar Hill #23 Rd
- 314 N Walnut St
- 1109 N Spruce St
- 3901 Cedar Hill Rd
- 516 N Oak St
- 324 N Jackson St
- 619 Ash St
- 617 Ash St
- 2612 Kavanaugh Blvd
- 4402 Woodlawn Dr
- 603 Ash St
- 2521 Kavanaugh Blvd
- 000 Cedar Glade Trail
- 0 Cedar Glade Trail Unit 16022477
- 2622 Kavanaugh Blvd
- 710 Walnut St
- 601 Ash St
- 2517 Kavanaugh Blvd
- 705 Ash St
- 4320 Woodlawn Dr
- 712 Walnut St
- 712 Walnut St
- 709 Ash St
- 2515 Kavanaugh Blvd
- 4318 Woodlawn Dr
- 614 Ash St