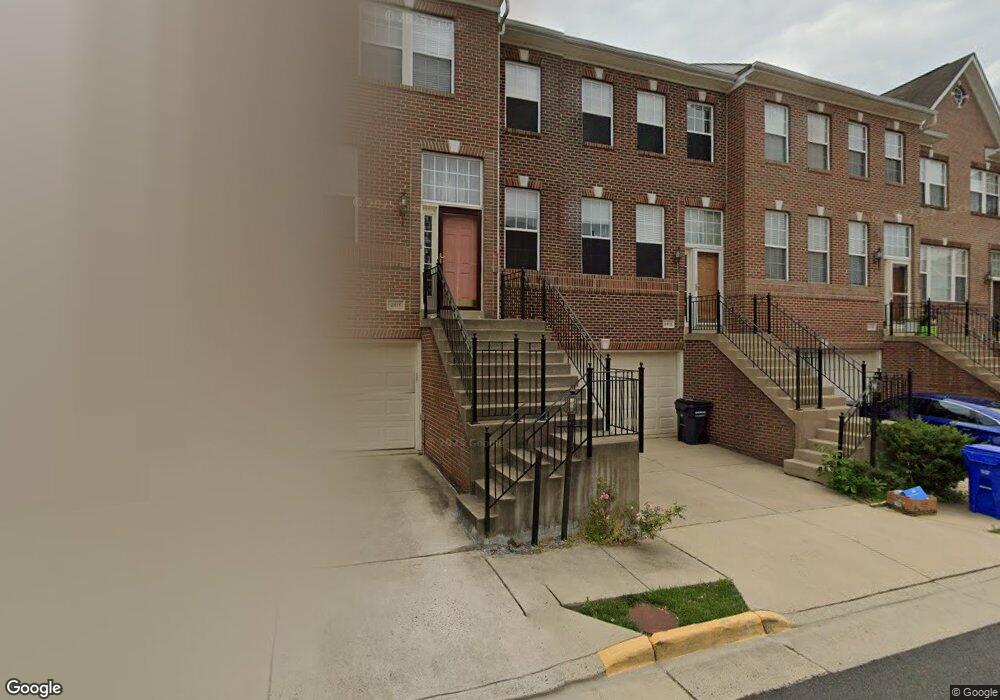
2611 Logan Wood Dr Herndon, VA 20171
Estimated Value: $671,078 - $700,000
3
Beds
4
Baths
2,500
Sq Ft
$275/Sq Ft
Est. Value
About This Home
Beautiful two car garage town home in sought after location. Close to Dulles Airport and accessible to major highways. Elegant hard wood flooring on two levels including stairs, remodeled kitchen and bath rooms. New appliances. Large Deck and fenced back yard is an added advantage.
2 full baths and 2 half baths.
The community facilities include Tennis courts, Basket ball court and children play .
Tour to visit can be scheduled.
Ownership History
Date
Name
Owned For
Owner Type
Purchase Details
Closed on
Aug 26, 2003
Sold by
Leisten David M
Bought by
Sankararaman Siva
Current Estimated Value
Home Financials for this Owner
Home Financials are based on the most recent Mortgage that was taken out on this home.
Original Mortgage
$277,600
Outstanding Balance
$122,370
Interest Rate
5.52%
Mortgage Type
New Conventional
Estimated Equity
$566,150
Purchase Details
Closed on
Nov 30, 1999
Sold by
Engle Homes Virgina Inc
Bought by
Lesiten David M
Home Financials for this Owner
Home Financials are based on the most recent Mortgage that was taken out on this home.
Original Mortgage
$204,200
Interest Rate
7.86%
Create a Home Valuation Report for This Property
The Home Valuation Report is an in-depth analysis detailing your home's value as well as a comparison with similar homes in the area
Home Values in the Area
Average Home Value in this Area
Purchase History
| Date | Buyer | Sale Price | Title Company |
|---|---|---|---|
| Sankararaman Siva | $347,000 | -- | |
| Lesiten David M | $215,017 | -- |
Source: Public Records
Mortgage History
| Date | Status | Borrower | Loan Amount |
|---|---|---|---|
| Open | Sankararaman Siva | $277,600 | |
| Previous Owner | Lesiten David M | $204,200 |
Source: Public Records
Property History
| Date | Event | Price | List to Sale | Price per Sq Ft |
|---|---|---|---|---|
| 09/08/2024 09/08/24 | For Rent | $3,100 | -- | -- |
Tax History Compared to Growth
Tax History
| Year | Tax Paid | Tax Assessment Tax Assessment Total Assessment is a certain percentage of the fair market value that is determined by local assessors to be the total taxable value of land and additions on the property. | Land | Improvement |
|---|---|---|---|---|
| 2025 | $7,104 | $656,340 | $200,000 | $456,340 |
| 2024 | $7,104 | $613,230 | $185,000 | $428,230 |
| 2023 | $6,787 | $601,410 | $180,000 | $421,410 |
| 2022 | $6,638 | $580,500 | $170,000 | $410,500 |
| 2021 | $6,352 | $541,320 | $160,000 | $381,320 |
| 2020 | $5,736 | $484,670 | $120,000 | $364,670 |
| 2019 | $5,922 | $500,400 | $120,000 | $380,400 |
| 2018 | $5,592 | $486,260 | $110,000 | $376,260 |
| 2017 | $5,645 | $486,260 | $110,000 | $376,260 |
| 2016 | $5,633 | $486,260 | $110,000 | $376,260 |
| 2015 | $5,427 | $486,260 | $110,000 | $376,260 |
| 2014 | $5,233 | $469,920 | $110,000 | $359,920 |
Source: Public Records
Map
Nearby Homes
- 13286 Coppermill Dr
- 2559 Peter Jefferson Ln
- 13222 Stable Brook Way
- 2492 Quick St Unit 103
- 2546 James Maury Dr
- 3499 Audubon Cove
- 3495 Audubon Cove
- 13123 Copper Brook Way
- 2447 Clover Field Cir
- 2466 Clover Field Cir
- 13506 Innovation Station Loop Unit 2B
- 13083 Rose Petal Cir
- 13103 Anvil Place
- 0A River Birch Rd
- 0A-2 River Birch Rd
- 13056 Marcey Creek Rd Unit 13056
- 13603 Floris St
- 2611 River Birch Rd
- 2605 River Birch Rd
- 13104 Meadow Hall Ct
- 2613 Logan Wood Dr
- 2609 Logan Wood Dr
- 2615 Logan Wood Dr
- 2605 Logan Wood Dr
- 2617 Logan Wood Dr
- 2603 Logan Wood Dr
- 2619 Logan Wood Dr
- 2601 Logan Wood Dr
- 2610 Logan Wood Dr
- 2612 Logan Wood Dr
- 2608 Logan Wood Dr
- 2614 Logan Wood Dr
- 2616 Logan Wood Dr
- 2604 Logan Wood Dr
- 2599 Logan Wood Dr
- 2618 Logan Wood Dr
- 2602 Logan Wood Dr
- 2597 Logan Wood Dr
- 2620 Logan Wood Dr
- 2595 Logan Wood Dr