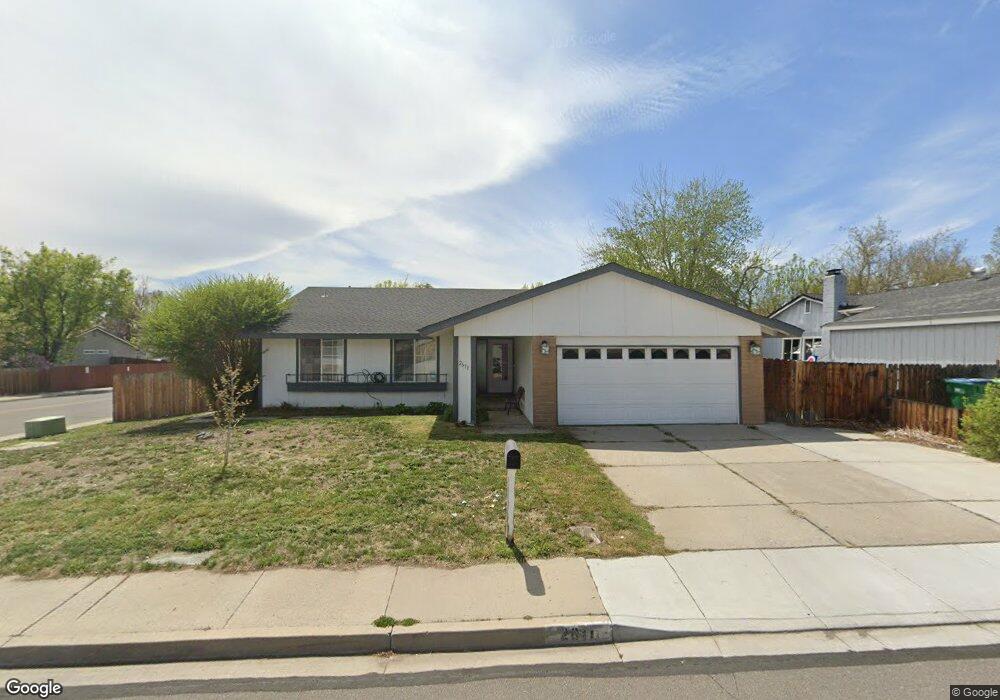
2611 Monte Verde Way Sparks, NV 89434
Reed NeighborhoodEstimated Value: $420,000 - $463,000
3
Beds
2
Baths
1,616
Sq Ft
$271/Sq Ft
Est. Value
About This Home
This home is located at 2611 Monte Verde Way, Sparks, NV 89434 and is currently estimated at $438,376, approximately $271 per square foot. 2611 Monte Verde Way is a home located in Washoe County with nearby schools including Lloyd Diedrichsen Elementary School, Lou Mendive Middle School, and Edward C Reed High School.
Ownership History
Date
Name
Owned For
Owner Type
Purchase Details
Closed on
May 1, 2020
Sold by
Shabazz Karim and Shabazz Hassan
Bought by
Alterman Phillip Samuel and Lopchuk Jeffrey Kent
Current Estimated Value
Home Financials for this Owner
Home Financials are based on the most recent Mortgage that was taken out on this home.
Original Mortgage
$290,000
Outstanding Balance
$256,980
Interest Rate
3.3%
Mortgage Type
New Conventional
Estimated Equity
$181,396
Purchase Details
Closed on
Oct 22, 2008
Sold by
Shabazz Maurice N and Shabazz Denise K
Bought by
Shabazz Maurice and Shabazz Denise
Purchase Details
Closed on
Oct 29, 1993
Sold by
Ekechukwu Geoffrey A and Ekechukwu Patricia A
Bought by
Shabazz Maurice N and Shabazz Denise K
Home Financials for this Owner
Home Financials are based on the most recent Mortgage that was taken out on this home.
Original Mortgage
$108,000
Interest Rate
6.85%
Create a Home Valuation Report for This Property
The Home Valuation Report is an in-depth analysis detailing your home's value as well as a comparison with similar homes in the area
Home Values in the Area
Average Home Value in this Area
Purchase History
| Date | Buyer | Sale Price | Title Company |
|---|---|---|---|
| Alterman Phillip Samuel | $325,000 | Acme Title & Escrow Services | |
| Shabazz Maurice | -- | None Available | |
| Shabazz Maurice N | $120,000 | Western Title Company Inc |
Source: Public Records
Mortgage History
| Date | Status | Borrower | Loan Amount |
|---|---|---|---|
| Open | Alterman Phillip Samuel | $290,000 | |
| Previous Owner | Shabazz Maurice N | $108,000 |
Source: Public Records
Tax History Compared to Growth
Tax History
| Year | Tax Paid | Tax Assessment Tax Assessment Total Assessment is a certain percentage of the fair market value that is determined by local assessors to be the total taxable value of land and additions on the property. | Land | Improvement |
|---|---|---|---|---|
| 2025 | $1,647 | $65,542 | $36,120 | $29,422 |
| 2024 | $1,600 | $63,666 | $33,215 | $30,451 |
| 2023 | $1,600 | $64,700 | $35,175 | $29,525 |
| 2022 | $1,554 | $51,905 | $26,740 | $25,165 |
| 2021 | $1,509 | $47,381 | $21,735 | $25,646 |
| 2020 | $1,464 | $46,953 | $20,720 | $26,233 |
| 2019 | $2,236 | $46,582 | $20,720 | $25,862 |
| 2018 | $2,089 | $40,235 | $14,455 | $25,780 |
| 2017 | $1,340 | $39,988 | $13,720 | $26,268 |
| 2016 | $1,305 | $39,461 | $12,250 | $27,211 |
| 2015 | $1,303 | $37,961 | $10,325 | $27,636 |
| 2014 | $1,267 | $36,044 | $9,030 | $27,014 |
| 2013 | -- | $33,833 | $6,860 | $26,973 |
Source: Public Records
Map
Nearby Homes
- 2688 Laguna Way
- 2763 Blossom View Dr
- 1428 Del Rosa Way
- 2629 Sunny Slope Dr Unit 3
- 2311 Sycamore Glen Dr Unit 4
- 2407 Sunny Slope Dr Unit 1
- 2435 Sycamore Glen Dr Unit A
- 2475 Sycamore Glen Dr Unit 1
- 2511 Sycamore Glen Dr Unit 4
- 3127 Montezuma Way
- 2479 Napoli Dr
- 3156 Waterfield Dr
- 1821 Fargo Way
- 3238 Candelaria Dr
- 1731 Golden Spike Dr
- 2078 Tivoli Ln
- 3253 Clan Alpine Dr
- 1575 Olinghouse St
- 1066 Locomotive Ct Unit 11A
- 2030 Avella Dr
- 2611 Monte Verde Way Unit Way
- 2631 Monte Verde Way
- 1562 Del Rosa Way
- 1552 Del Rosa Way
- 2651 Monte Verde Way
- 2612 Monte Verde Way
- 2591 Monte Verde Way
- 2632 Monte Verde Way
- 2602 Monte Verde Way
- 1542 Del Rosa Way
- 1602 Del Rosa Way
- 2652 Monte Verde Way
- 2671 Monte Verde Way
- 2582 Monte Verde Way
- 1532 Del Rosa Way
- 2571 Monte Verde Way
- 2725 Laguna Way
- 1608 Del Rosa Way
- 2745 Laguna Way
- 2672 Monte Verde Way