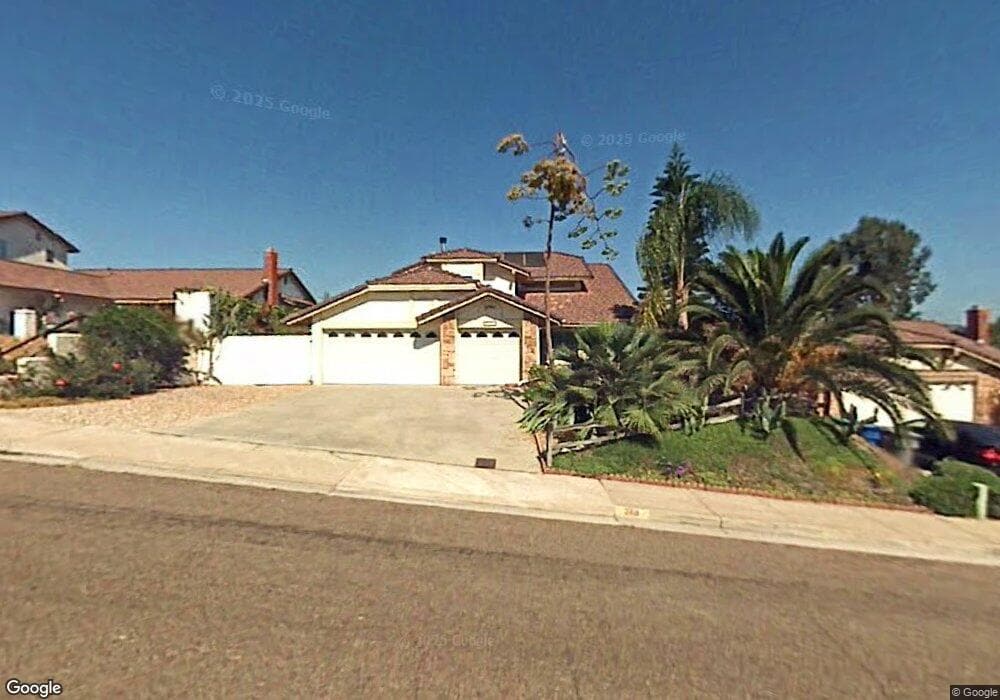
2611 Wind River Rd El Cajon, CA 92019
Rancho Park NeighborhoodEstimated Value: $1,009,000 - $1,171,000
4
Beds
3
Baths
2,436
Sq Ft
$461/Sq Ft
Est. Value
About This Home
This home is located at 2611 Wind River Rd, El Cajon, CA 92019 and is currently estimated at $1,122,161, approximately $460 per square foot. 2611 Wind River Rd is a home located in San Diego County with nearby schools including Vista Grande Elementary, Hillsdale Middle School, and Valhalla High.
Ownership History
Date
Name
Owned For
Owner Type
Purchase Details
Closed on
Jan 31, 2014
Sold by
Borowski Waldemar and Borowski Katarzyna
Bought by
Borowski Waldemar and Borowski Katarzyna
Current Estimated Value
Purchase Details
Closed on
Aug 27, 1997
Sold by
Clay John R and Clay Carrie L
Bought by
Borowski Waldemar and Borowski Katarzyna
Home Financials for this Owner
Home Financials are based on the most recent Mortgage that was taken out on this home.
Original Mortgage
$199,840
Interest Rate
7.54%
Purchase Details
Closed on
Aug 17, 1993
Sold by
Clay John Rufus and Clay Carrie Laura
Bought by
Clay John Rufus and Clay Carrie Laura
Home Financials for this Owner
Home Financials are based on the most recent Mortgage that was taken out on this home.
Original Mortgage
$197,250
Interest Rate
4.75%
Purchase Details
Closed on
Jan 4, 1985
Create a Home Valuation Report for This Property
The Home Valuation Report is an in-depth analysis detailing your home's value as well as a comparison with similar homes in the area
Home Values in the Area
Average Home Value in this Area
Purchase History
| Date | Buyer | Sale Price | Title Company |
|---|---|---|---|
| Borowski Waldemar | -- | None Available | |
| Borowski Waldemar | $250,000 | Chicago Title Co | |
| Clay John Rufus | -- | Continental Lawyers Title | |
| -- | $157,000 | -- |
Source: Public Records
Mortgage History
| Date | Status | Borrower | Loan Amount |
|---|---|---|---|
| Closed | Borowski Waldemar | $199,840 | |
| Previous Owner | Clay John Rufus | $197,250 |
Source: Public Records
Tax History
| Year | Tax Paid | Tax Assessment Tax Assessment Total Assessment is a certain percentage of the fair market value that is determined by local assessors to be the total taxable value of land and additions on the property. | Land | Improvement |
|---|---|---|---|---|
| 2025 | $5,236 | $430,200 | $115,059 | $315,141 |
| 2024 | $5,236 | $421,765 | $112,803 | $308,962 |
| 2023 | $5,098 | $413,496 | $110,592 | $302,904 |
| 2022 | $5,012 | $405,389 | $108,424 | $296,965 |
| 2021 | $4,943 | $397,442 | $106,299 | $291,143 |
| 2020 | $4,850 | $393,368 | $105,210 | $288,158 |
| 2019 | $4,791 | $385,656 | $103,148 | $282,508 |
| 2018 | $4,713 | $378,095 | $101,126 | $276,969 |
| 2017 | $4,652 | $370,683 | $99,144 | $271,539 |
| 2016 | $4,471 | $363,415 | $97,200 | $266,215 |
| 2015 | $4,440 | $357,957 | $95,740 | $262,217 |
| 2014 | $4,354 | $350,946 | $93,865 | $257,081 |
Source: Public Records
Map
Nearby Homes
- 2075 Pierce Ct
- 2552 Wind River Rd
- 2846 Willow Glen Dr
- 2026 Capri Ct
- 1781 Colter Lake Ct
- 2030 Seca St
- 2049 Wind River Rd
- 2011 Monarch Ridge Cir
- 1975 Julianna St
- 1810 Hillsdale Rd Unit 94
- 2450 Sawgrass St
- 1423 Vista Grande Rd
- 0 Hillsdale Rd Unit PTP2601192
- 12092 Calle de Leon Unit 45
- 12083 Calle de Montana Unit 219
- 12046 Calle de Montana Unit 274
- 1525 Fair Glen Rd
- 1426 Hidden Mesa View Dr
- 11438 Via Rancho San Diego Unit 141
- 1223 Burris Dr
- 2603 Wind River Rd
- 2619 Wind River Rd
- 2581 Wind River Rd
- 2627 Wind River Rd
- 2083 Pierce Ct
- 2076 Pierce Ct
- 2573 Wind River Rd
- 2107 Ricard Ct
- 2635 Wind River Rd
- 2106 Ricard Ct
- 2567 Wind River Rd
- 2624 Wind River Rd
- 2041 Ontario Ct
- 2117 Ricard Ct
- 2066 Pierce Ct
- 2116 Ricard Ct
- 2067 Pierce Ct
- 2049 Ontario Ct
- 2561 Wind River Rd
- 2630 Wind River Rd
Your Personal Tour Guide
Ask me questions while you tour the home.