Estimated Value: $816,865
--
Bed
--
Bath
10,000
Sq Ft
$82/Sq Ft
Est. Value
About This Home
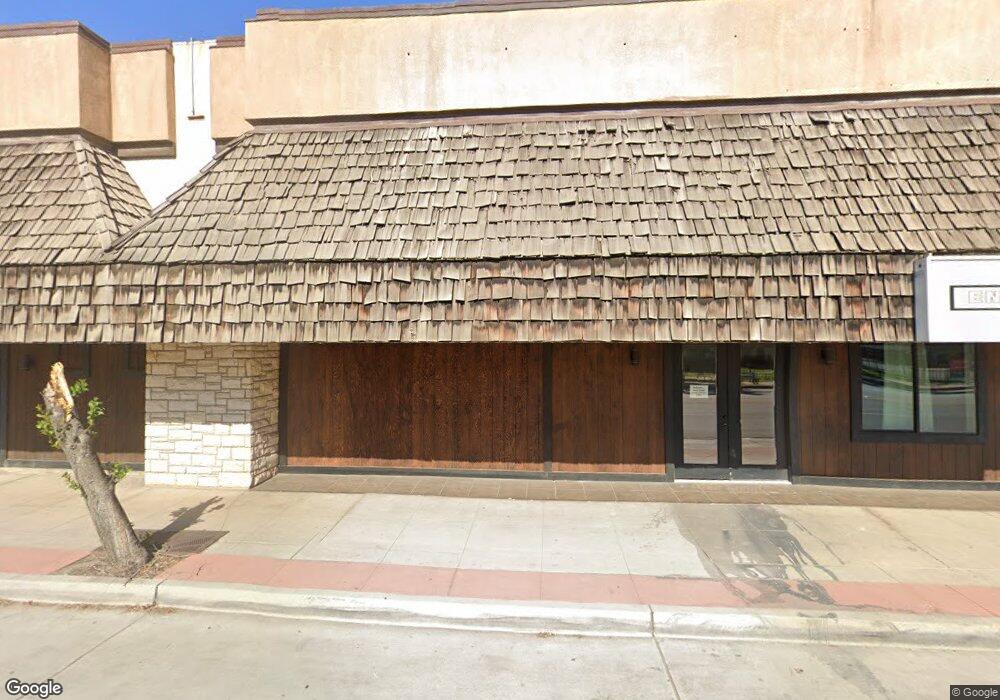
This home is located at 2612 F St, Bakersfield, CA 93301 and is currently estimated at $816,865, approximately $81 per square foot. 2612 F St is a home located in Kern County with nearby schools including Franklin Elementary School, Emerson Middle School, and Bakersfield High School.
Ownership History
Date
Name
Owned For
Owner Type
Purchase Details
Closed on
Feb 17, 2023
Sold by
Vantassell Rhonda Jeanette
Bought by
Rhonda J Van Tassell Trust
Current Estimated Value
Purchase Details
Closed on
Aug 21, 2018
Sold by
P & G Properties No 1 Llc
Bought by
Vantassell Rhonda Jeanette
Home Financials for this Owner
Home Financials are based on the most recent Mortgage that was taken out on this home.
Original Mortgage
$400,000
Interest Rate
4.5%
Mortgage Type
Purchase Money Mortgage
Purchase Details
Closed on
Sep 13, 2011
Sold by
Santoshi No Four Lp
Bought by
D Pragati Patel M
Purchase Details
Closed on
Sep 1, 2011
Sold by
Patel M D Girish and D Pragati Patel M
Bought by
Patel Girish
Purchase Details
Closed on
Aug 12, 2005
Sold by
Sullivan Alice R and The Sullivan Spousal Trust
Bought by
Santoshi #4 Lp
Purchase Details
Closed on
Aug 7, 2005
Sold by
Sullivan Properties Lp
Bought by
Sullivan Alice R and The Sullivan Spousal Trust
Purchase Details
Closed on
Sep 28, 2000
Sold by
Sullivan Spousal Trust and Alice R
Bought by
Sullivan Properties Lp
Create a Home Valuation Report for This Property
The Home Valuation Report is an in-depth analysis detailing your home's value as well as a comparison with similar homes in the area
Home Values in the Area
Average Home Value in this Area
Purchase History
| Date | Buyer | Sale Price | Title Company |
|---|---|---|---|
| Rhonda J Van Tassell Trust | -- | None Listed On Document | |
| Vantassell Rhonda Jeanette | $500,000 | Chicago Title Co | |
| D Pragati Patel M | -- | None Available | |
| Patel Girish | -- | None Available | |
| D Pragati Patel M | -- | None Available | |
| Santoshi #4 Lp | $575,000 | -- | |
| Sullivan Alice R | -- | -- | |
| Sullivan Properties Lp | -- | -- |
Source: Public Records
Mortgage History
| Date | Status | Borrower | Loan Amount |
|---|---|---|---|
| Previous Owner | Vantassell Rhonda Jeanette | $400,000 |
Source: Public Records
Tax History Compared to Growth
Tax History
| Year | Tax Paid | Tax Assessment Tax Assessment Total Assessment is a certain percentage of the fair market value that is determined by local assessors to be the total taxable value of land and additions on the property. | Land | Improvement |
|---|---|---|---|---|
| 2025 | $6,676 | $557,754 | $133,860 | $423,894 |
| 2024 | $6,676 | $546,819 | $131,236 | $415,583 |
| 2023 | $6,558 | $536,098 | $128,663 | $407,435 |
| 2022 | $6,460 | $525,588 | $126,141 | $399,447 |
| 2021 | $6,390 | $515,283 | $123,668 | $391,615 |
| 2020 | $6,379 | $510,000 | $122,400 | $387,600 |
| 2019 | $6,254 | $510,000 | $122,400 | $387,600 |
| 2018 | $8,507 | $690,594 | $156,132 | $534,462 |
| 2017 | $8,479 | $677,054 | $153,071 | $523,983 |
| 2016 | $7,638 | $663,779 | $150,070 | $513,709 |
| 2015 | $7,624 | $653,809 | $147,816 | $505,993 |
| 2014 | $7,371 | $641,003 | $144,921 | $496,082 |
Source: Public Records
Map
Nearby Homes