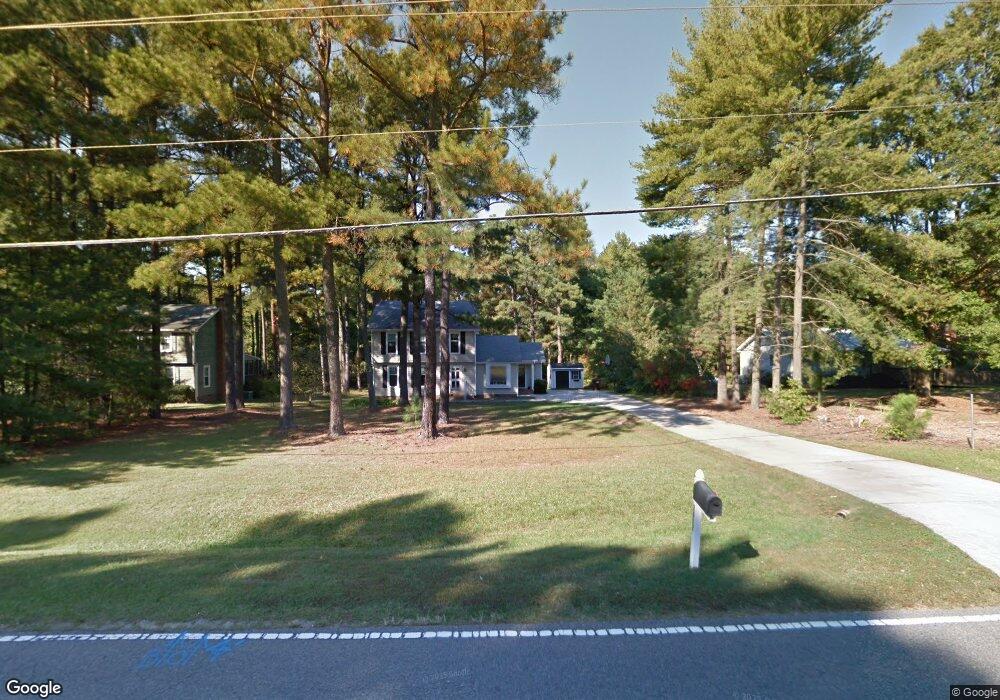
2612 Howard Rd Raleigh, NC 27613
Stonehenge NeighborhoodEstimated Value: $509,373 - $545,000
3
Beds
3
Baths
1,972
Sq Ft
$267/Sq Ft
Est. Value
About This Home
This home is located at 2612 Howard Rd, Raleigh, NC 27613 and is currently estimated at $526,843, approximately $267 per square foot. 2612 Howard Rd is a home located in Wake County with nearby schools including Jeffreys Grove Elementary School, Carroll Middle, and Sanderson High School.
Ownership History
Date
Name
Owned For
Owner Type
Purchase Details
Closed on
Aug 7, 2019
Sold by
Opendoor Property C Llc
Bought by
Bryant Jonathan and Ozono Caz
Current Estimated Value
Home Financials for this Owner
Home Financials are based on the most recent Mortgage that was taken out on this home.
Original Mortgage
$279,000
Outstanding Balance
$244,352
Interest Rate
3.7%
Mortgage Type
New Conventional
Estimated Equity
$282,491
Purchase Details
Closed on
Apr 25, 2019
Sold by
Dautrich Daniel J and Ewaniszyk Barbara L
Bought by
Opendoor Property C Llc
Purchase Details
Closed on
Sep 21, 2001
Sold by
Roper Susan Hill and Roper Wayne Arthur
Bought by
Dautrich Daniel J and Ewaniszyk Barbara L
Home Financials for this Owner
Home Financials are based on the most recent Mortgage that was taken out on this home.
Original Mortgage
$189,210
Interest Rate
6.5%
Mortgage Type
VA
Create a Home Valuation Report for This Property
The Home Valuation Report is an in-depth analysis detailing your home's value as well as a comparison with similar homes in the area
Home Values in the Area
Average Home Value in this Area
Purchase History
| Date | Buyer | Sale Price | Title Company |
|---|---|---|---|
| Bryant Jonathan | $310,500 | None Available | |
| Opendoor Property C Llc | $309,000 | None Available | |
| Dautrich Daniel J | $186,000 | -- |
Source: Public Records
Mortgage History
| Date | Status | Borrower | Loan Amount |
|---|---|---|---|
| Open | Bryant Jonathan | $279,000 | |
| Previous Owner | Dautrich Daniel J | $189,210 |
Source: Public Records
Tax History Compared to Growth
Tax History
| Year | Tax Paid | Tax Assessment Tax Assessment Total Assessment is a certain percentage of the fair market value that is determined by local assessors to be the total taxable value of land and additions on the property. | Land | Improvement |
|---|---|---|---|---|
| 2025 | $2,950 | $458,141 | $160,000 | $298,141 |
| 2024 | $2,865 | $458,141 | $160,000 | $298,141 |
| 2023 | $2,576 | $327,770 | $100,000 | $227,770 |
| 2022 | $2,387 | $327,770 | $100,000 | $227,770 |
| 2021 | $2,323 | $327,770 | $100,000 | $227,770 |
| 2020 | $2,285 | $327,770 | $100,000 | $227,770 |
| 2019 | $2,299 | $279,061 | $100,000 | $179,061 |
| 2018 | $2,114 | $279,061 | $100,000 | $179,061 |
| 2017 | $2,004 | $279,061 | $100,000 | $179,061 |
| 2016 | $1,964 | $279,061 | $100,000 | $179,061 |
| 2015 | $1,803 | $256,684 | $86,000 | $170,684 |
| 2014 | $1,709 | $256,684 | $86,000 | $170,684 |
Source: Public Records
Map
Nearby Homes
- 7771 Falcon Rest Cir Unit 7771
- 8404 Sleepy Creek Dr
- 2704 Smokey Ridge Rd
- 7740 Wilderness Rd
- 3008 Eden Harbor Ct
- 2610 Sawmill Rd
- 7741 Wilderness Rd
- 2204 Middlefield Ct
- 8100 Laurel Mountain Rd
- 7628 Valview St
- 8920 Taymouth Ct
- 7922 Footman Way
- 7601 Valview St
- 2428 Havershire Dr
- 8605 Brookdale Dr
- 2609 Cobworth Ct
- 8604 Wellsley Way
- 7401 Ray Rd
- 8521 Harbor Dr
- 6901 Saxby Ct
- 2616 Howard Rd
- 2600 Howard Rd
- 2609 Salisbury Plain
- 8000 New London Ln
- 2613 Salisbury Plain
- 2701 Farnborough Rd
- 8002 New London Ln
- 2700 Farnborough Rd
- 2605 Salisbury Plain
- 8004 New London Ln
- 2601 Howard Rd
- 2617 Salisbury Plain
- 2613 Howard Rd
- 8008 New London Ln
- 2601 Salisbury Plain
- 2705 Farnborough Rd
- 2521 Howard Rd
- 2701 Howard Rd
- 8012 New London Ln
- 8001 New London Ln