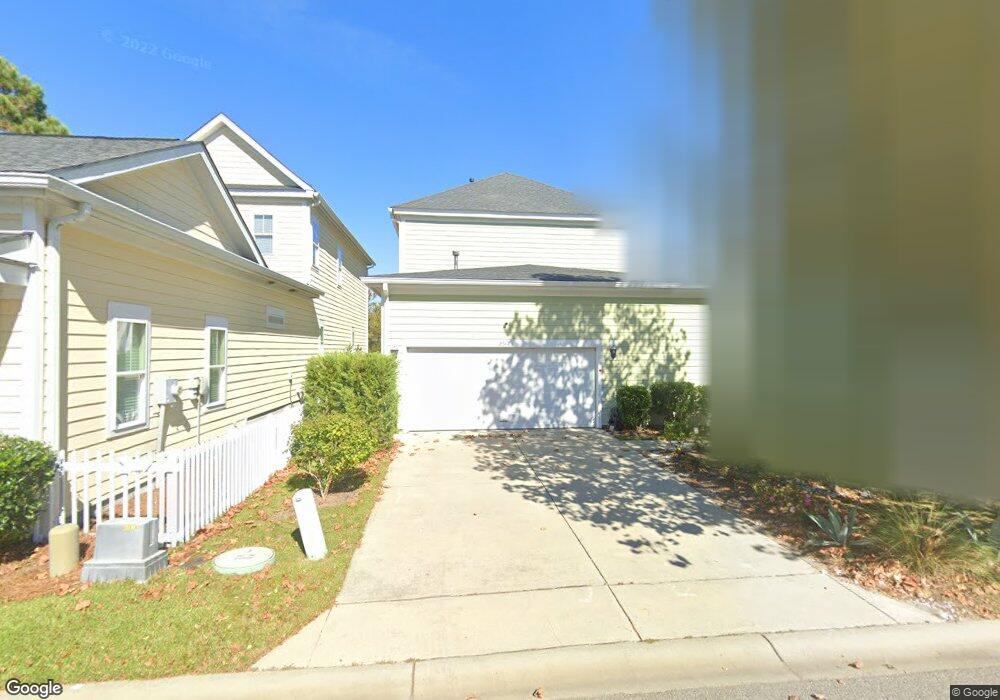
2612 Kruzel St Unit Lancaster Myrtle Beach, SC 29577
Market Commons NeighborhoodEstimated Value: $512,087 - $637,000
3
Beds
3
Baths
1,934
Sq Ft
$288/Sq Ft
Est. Value
About This Home
This home is located at 2612 Kruzel St Unit Lancaster, Myrtle Beach, SC 29577 and is currently estimated at $557,772, approximately $288 per square foot. 2612 Kruzel St Unit Lancaster is a home located in Horry County with nearby schools including Myrtle Beach Child Development Center, Myrtle Beach Primary School, and Myrtle Beach Elementary School.
Ownership History
Date
Name
Owned For
Owner Type
Purchase Details
Closed on
Mar 26, 2021
Sold by
Benkovski Boris
Bought by
Doncaster Gerald
Current Estimated Value
Home Financials for this Owner
Home Financials are based on the most recent Mortgage that was taken out on this home.
Original Mortgage
$319,410
Outstanding Balance
$287,923
Interest Rate
2.9%
Mortgage Type
New Conventional
Estimated Equity
$269,849
Purchase Details
Closed on
Oct 26, 2016
Sold by
Hubbard Tyson H
Bought by
Benkovski Boris and Benkovski Eugenia
Home Financials for this Owner
Home Financials are based on the most recent Mortgage that was taken out on this home.
Original Mortgage
$260,000
Interest Rate
3.42%
Mortgage Type
New Conventional
Purchase Details
Closed on
Jan 7, 2014
Sold by
Dock Street Communities
Bought by
Hubbard Tyson H
Home Financials for this Owner
Home Financials are based on the most recent Mortgage that was taken out on this home.
Original Mortgage
$208,067
Interest Rate
4.29%
Mortgage Type
New Conventional
Create a Home Valuation Report for This Property
The Home Valuation Report is an in-depth analysis detailing your home's value as well as a comparison with similar homes in the area
Home Values in the Area
Average Home Value in this Area
Purchase History
| Date | Buyer | Sale Price | Title Company |
|---|---|---|---|
| Doncaster Gerald | $354,900 | -- | |
| Benkovski Boris | $325,000 | -- | |
| Hubbard Tyson H | $260,084 | -- | |
| Hubbard Tyson H | $260,084 | -- |
Source: Public Records
Mortgage History
| Date | Status | Borrower | Loan Amount |
|---|---|---|---|
| Open | Doncaster Gerald | $319,410 | |
| Previous Owner | Benkovski Boris | $260,000 | |
| Previous Owner | Hubbard Tyson H | $208,067 |
Source: Public Records
Tax History Compared to Growth
Tax History
| Year | Tax Paid | Tax Assessment Tax Assessment Total Assessment is a certain percentage of the fair market value that is determined by local assessors to be the total taxable value of land and additions on the property. | Land | Improvement |
|---|---|---|---|---|
| 2024 | $6,839 | $26,864 | $8,688 | $18,176 |
| 2023 | $6,839 | $13,358 | $3,914 | $9,444 |
| 2021 | $6,325 | $20,036 | $5,870 | $14,166 |
| 2020 | $1,064 | $13,358 | $3,914 | $9,444 |
| 2019 | $1,024 | $13,358 | $3,914 | $9,444 |
| 2018 | $0 | $12,668 | $3,216 | $9,452 |
| 2017 | -- | $12,668 | $3,216 | $9,452 |
| 2016 | -- | $10,864 | $2,680 | $8,184 |
| 2015 | $4,238 | $16,297 | $4,021 | $12,276 |
| 2014 | $758 | $3,000 | $3,000 | $0 |
Source: Public Records
Map
Nearby Homes
- 861 Murray Ave
- 830 Howard Ave Unit D
- 750 Howard Ave Unit D
- 750 Howard Ave Unit E
- 524 Farrow Pkwy
- 736 Satterwhite Way
- 804 Shine Ave
- 2790 Howard Ave Unit D
- 750 Shine Ave Unit 750
- 1411 Peterson St
- 800 Curtis Brown Ln
- 853 Johnson Ave
- 3429 Thrash Way
- 962 Hendrick Ave
- 3452 Baldwin Ln
- 852 Iris St Unit D
- 763 Moen Place Unit 763-B
- 945 Rosencrans Ln Unit B
- 3506 Evergreen Way
- 780 Gabreski Ln Unit A-2
- 2612 Kruzel St
- Lot # 2 R1 2612 Kruzel St
- 2616 Kruzel St
- 2608 Kruzel St Unit The Verdier
- 2608 Kruzel St Unit Verdier
- 2608 Kruzel St
- R11 Lot 26 Not Specified
- R11 Lot 28 Not Specified
- 2604 Kruzel St
- 2600 Kruzel St
- 2600 Kruzel St Unit The Dorchester
- 2613 Kruzel St Unit York
- 2609 Kruzel St Unit The Olivia
- 2609 Kruzel St Unit The Olivia
- 2609 Kruzel St
- 781 Johnson Ave
- 775 Johnson Ave Unit The Olivia
- 775 Johnson Ave Unit Olivia
- 775 Johnson Ave
- Lot 2 R10N Kruzel St Unit Lancaster