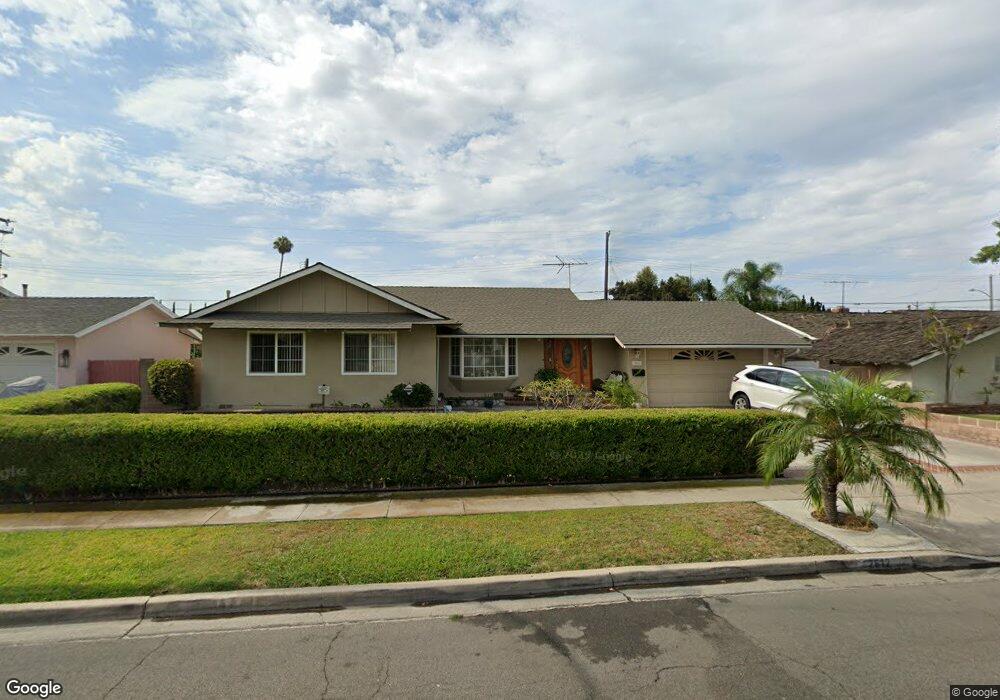
2612 W Westhaven Dr Anaheim, CA 92804
West Anaheim NeighborhoodEstimated Value: $937,000 - $1,014,000
4
Beds
3
Baths
1,791
Sq Ft
$550/Sq Ft
Est. Value
About This Home
This home is located at 2612 W Westhaven Dr, Anaheim, CA 92804 and is currently estimated at $984,405, approximately $549 per square foot. 2612 W Westhaven Dr is a home located in Orange County with nearby schools including Mattie Lou Maxwell Elementary School, Dale Jr High School, and Magnolia High.
Ownership History
Date
Name
Owned For
Owner Type
Purchase Details
Closed on
Oct 21, 2025
Sold by
Nguyen Trung Khac and Pham Kim My
Bought by
Trung And Kim Living Trust and Nguyen
Current Estimated Value
Purchase Details
Closed on
Jun 22, 2011
Sold by
Pham Kim My
Bought by
Nguyen Trung Khac and Pham Kim My
Purchase Details
Closed on
Jul 29, 2000
Sold by
Nguyen Trung Khac and Pham Kim My
Bought by
Pham Kim My
Purchase Details
Closed on
Aug 2, 1999
Sold by
Alex Vazquez and Alex Orchid
Bought by
Nguyen Trung Khac and Pham Kim My
Home Financials for this Owner
Home Financials are based on the most recent Mortgage that was taken out on this home.
Original Mortgage
$170,000
Interest Rate
7.89%
Purchase Details
Closed on
Mar 27, 1997
Sold by
Alex Vazquez and Orchid Vazquez Orchid
Bought by
Vazquez Alex and Vazquez Orchid
Create a Home Valuation Report for This Property
The Home Valuation Report is an in-depth analysis detailing your home's value as well as a comparison with similar homes in the area
Home Values in the Area
Average Home Value in this Area
Purchase History
| Date | Buyer | Sale Price | Title Company |
|---|---|---|---|
| Trung And Kim Living Trust | -- | None Listed On Document | |
| Nguyen Trung Khac | -- | Accommodation | |
| Pham Kim My | -- | Southland Title Corporation | |
| Nguyen Trung Khac | $212,500 | Commonwealth Land Title | |
| Vazquez Alex | -- | -- |
Source: Public Records
Mortgage History
| Date | Status | Borrower | Loan Amount |
|---|---|---|---|
| Previous Owner | Nguyen Trung Khac | $170,000 |
Source: Public Records
Tax History Compared to Growth
Tax History
| Year | Tax Paid | Tax Assessment Tax Assessment Total Assessment is a certain percentage of the fair market value that is determined by local assessors to be the total taxable value of land and additions on the property. | Land | Improvement |
|---|---|---|---|---|
| 2025 | $4,281 | $374,219 | $242,049 | $132,170 |
| 2024 | $4,281 | $366,882 | $237,303 | $129,579 |
| 2023 | $4,169 | $359,689 | $232,650 | $127,039 |
| 2022 | $4,126 | $352,637 | $228,088 | $124,549 |
| 2021 | $4,075 | $345,723 | $223,616 | $122,107 |
| 2020 | $4,052 | $342,179 | $221,324 | $120,855 |
| 2019 | $3,952 | $335,470 | $216,984 | $118,486 |
| 2018 | $3,903 | $328,893 | $212,730 | $116,163 |
| 2017 | $3,766 | $322,445 | $208,559 | $113,886 |
| 2016 | $3,746 | $316,123 | $204,470 | $111,653 |
| 2015 | $3,713 | $311,375 | $201,399 | $109,976 |
| 2014 | $3,528 | $305,276 | $197,454 | $107,822 |
Source: Public Records
Map
Nearby Homes
- 2550 W Rowland Ave
- 837 S Magnolia Ave
- 2517 W Merle Place
- 507 S Shields Dr
- 927 S Webster Ave
- 2513 W Fulcrum Place
- 2513 W Mall Place
- 134 S Magnolia Ave Unit 4C
- 1234 S Macduff St
- 2435 W Broadway
- 8921 Kennelly Ln
- 2432 W Transit Ave
- 1223 S Dale Ave
- 2770 W Lincoln Ave Unit 29A
- 2770 W Lincoln Ave Unit 40
- 2770 W Lincoln Ave Unit 58
- 199 N Magnolia Ave Unit B
- 2533 W Chanticleer Rd
- 2945 W Bridgeport Ave
- Plan 4 at Townes at Orange
- 2608 W Westhaven Dr
- 2618 W Westhaven Dr
- 636 S Kenmore St
- 621 S Magnolia Ave
- 2604 W Westhaven Dr
- 2617 W Westhaven Dr
- 2611 W Westhaven Dr
- 640 S Kenmore St
- 618 S Kenmore St
- 2605 W Westhaven Dr
- 2626 W Westhaven Dr
- 645 S Magnolia Ave
- 612 S Kenmore St
- 637 S Kenmore St
- 700 S Kenmore St
- 2632 W Westhaven Dr
- 641 S Kenmore St
- 619 S Kenmore St
- 608 S Kenmore St
- 651 S Magnolia Ave