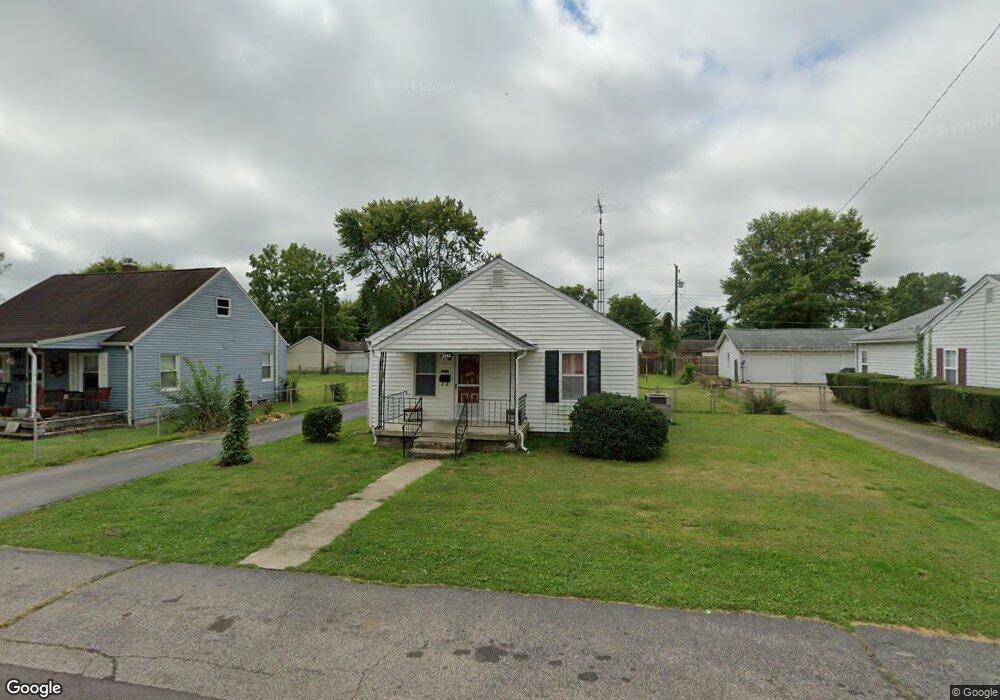
2613 13th St Columbus, IN 47201
Estimated Value: $169,000 - $201,000
2
Beds
1
Bath
1,076
Sq Ft
$169/Sq Ft
Est. Value
About This Home
This home is located at 2613 13th St, Columbus, IN 47201 and is currently estimated at $181,994, approximately $169 per square foot. 2613 13th St is a home located in Bartholomew County with nearby schools including L.F. Smith Elementary School, Central Middle School, and Columbus East High School.
Ownership History
Date
Name
Owned For
Owner Type
Purchase Details
Closed on
Dec 14, 2021
Sold by
Rivera Elizabeth A
Bought by
R & R Columbus Holdings
Current Estimated Value
Purchase Details
Closed on
Dec 18, 2015
Sold by
Woodcock Donald B and Woodcock Teresa E
Bought by
Rivera Elizabeth A
Purchase Details
Closed on
Apr 23, 2015
Sold by
Us Bank National Association and Jones Patricia A
Bought by
Woodcock Donald B and Woodcock Teresa E
Purchase Details
Closed on
Apr 14, 2015
Sold by
Sheriff Myers
Bought by
Donald and Teresa
Create a Home Valuation Report for This Property
The Home Valuation Report is an in-depth analysis detailing your home's value as well as a comparison with similar homes in the area
Home Values in the Area
Average Home Value in this Area
Purchase History
| Date | Buyer | Sale Price | Title Company |
|---|---|---|---|
| R & R Columbus Holdings | -- | None Available | |
| Rivera Elizabeth A | -- | Attorney | |
| Woodcock Donald B | $41,000 | None Available | |
| Donald | $41,000 | Barth Co Sheriff'S Office |
Source: Public Records
Tax History Compared to Growth
Tax History
| Year | Tax Paid | Tax Assessment Tax Assessment Total Assessment is a certain percentage of the fair market value that is determined by local assessors to be the total taxable value of land and additions on the property. | Land | Improvement |
|---|---|---|---|---|
| 2024 | $2,923 | $130,000 | $25,100 | $104,900 |
| 2023 | $3,133 | $138,000 | $29,400 | $108,600 |
| 2022 | $2,811 | $124,200 | $29,400 | $94,800 |
| 2021 | $2,597 | $113,700 | $17,400 | $96,300 |
| 2020 | $1,899 | $83,300 | $17,400 | $65,900 |
| 2019 | $1,627 | $76,300 | $17,400 | $58,900 |
| 2018 | $1,862 | $73,400 | $17,400 | $56,000 |
| 2017 | $1,585 | $72,800 | $16,700 | $56,100 |
| 2016 | $1,590 | $72,800 | $16,700 | $56,100 |
| 2014 | $1,587 | $71,700 | $16,700 | $55,000 |
| 2013 | $1,587 | $71,700 | $16,700 | $55,000 |
Source: Public Records
Map
Nearby Homes