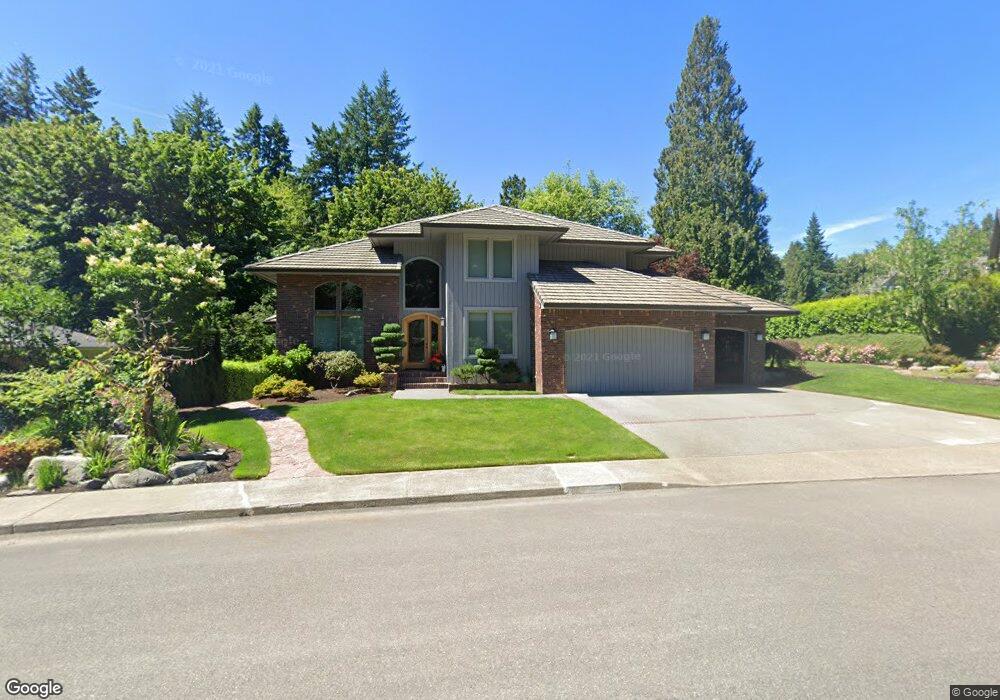
2613 Burnaby Park Loop SE Olympia, WA 98501
Cain Road NeighborhoodEstimated Value: $1,123,000 - $1,357,000
3
Beds
4
Baths
2,800
Sq Ft
$435/Sq Ft
Est. Value
About This Home
This home is located at 2613 Burnaby Park Loop SE, Olympia, WA 98501 and is currently estimated at $1,218,154, approximately $435 per square foot. 2613 Burnaby Park Loop SE is a home located in Thurston County with nearby schools including Pioneer Elementary School, Washington Middle School, and Olympia High School.
Ownership History
Date
Name
Owned For
Owner Type
Purchase Details
Closed on
Jun 4, 2001
Sold by
French Robert C and Nanieve C French F
Bought by
Schrank Fredrick A and Schrank Karen M
Current Estimated Value
Home Financials for this Owner
Home Financials are based on the most recent Mortgage that was taken out on this home.
Original Mortgage
$275,000
Interest Rate
7.14%
Purchase Details
Closed on
Aug 18, 1995
Sold by
Wyckoff Daniel W and Wyckoff Katherine A
Bought by
French Robert C and Nanieve C French F
Home Financials for this Owner
Home Financials are based on the most recent Mortgage that was taken out on this home.
Original Mortgage
$255,000
Interest Rate
7.5%
Create a Home Valuation Report for This Property
The Home Valuation Report is an in-depth analysis detailing your home's value as well as a comparison with similar homes in the area
Home Values in the Area
Average Home Value in this Area
Purchase History
| Date | Buyer | Sale Price | Title Company |
|---|---|---|---|
| Schrank Fredrick A | $440,000 | Chicago Title Insurance Co | |
| French Robert C | $365,000 | Thurston County Title Co |
Source: Public Records
Mortgage History
| Date | Status | Borrower | Loan Amount |
|---|---|---|---|
| Closed | Schrank Fredrick A | $275,000 | |
| Previous Owner | French Robert C | $255,000 |
Source: Public Records
Tax History Compared to Growth
Tax History
| Year | Tax Paid | Tax Assessment Tax Assessment Total Assessment is a certain percentage of the fair market value that is determined by local assessors to be the total taxable value of land and additions on the property. | Land | Improvement |
|---|---|---|---|---|
| 2024 | $11,440 | $1,245,800 | $209,800 | $1,036,000 |
| 2023 | $11,440 | $1,094,800 | $186,600 | $908,200 |
| 2022 | $10,821 | $1,128,900 | $148,400 | $980,500 |
| 2021 | $10,196 | $906,500 | $122,100 | $784,400 |
| 2020 | $10,226 | $790,500 | $134,000 | $656,500 |
| 2019 | $6,793 | $773,500 | $128,500 | $645,000 |
| 2018 | $9,142 | $679,100 | $119,900 | $559,200 |
| 2017 | $7,888 | $632,100 | $107,400 | $524,700 |
| 2016 | $7,618 | $594,850 | $98,550 | $496,300 |
| 2014 | -- | $609,950 | $97,150 | $512,800 |
Source: Public Records
Map
Nearby Homes
- 2802 Burnaby Park Loop SE
- 2413 28th Ave SE
- 2025 Eskridge Blvd SE
- 3056 Edgewood Dr SE
- 2418 22nd Ave SE
- 1824 Fairview St SE
- 0 xx Fairview St SE
- 1720 Wilson St SE
- 2937 Lybarger St SE
- 2911 Stirling Ct SE
- 1820 Chipman St SE Unit A&B
- 2534 Wedgewood Ct SE
- 1816 Chipman St SE Unit A&B
- 1910 van Epps St SE
- 2221 15th Ave SE
- 1812 Amhurst St SE
- 3424 Wagon Wheel St SE
- 3014 21st Ave SE
- 1717 14th Ave SE
- 3323 Amhurst St SE
- 2623 Burnaby Park Loop SE
- 2601 Burnaby Park Loop SE
- 2513 Burnaby Park Loop SE
- 2612 Burnaby Park Loop SE
- 2701 Burnaby Park Loop SE
- 2602 Burnaby Park Loop SE
- 2501 Burnaby Park Loop SE
- 2554 Burnaby Park Loop SE
- 2526 Burnaby Park Loop SE
- 2711 Burnaby Park Loop SE
- 2711 Burnaby Pk Loop SE
- 2536 Burnaby Park Loop SE
- 2514 Burnaby Park Loop SE
- 2701 Raintree Ct SE
- 2010 Forest Hill Dr SE
- 2707 Raintree Ct SE
- 2502 Burnaby Park Loop SE
- 2542 Burnaby Park Loop SE
- 2617 Cain Rd SE
- 1929 Eastwood Dr SE