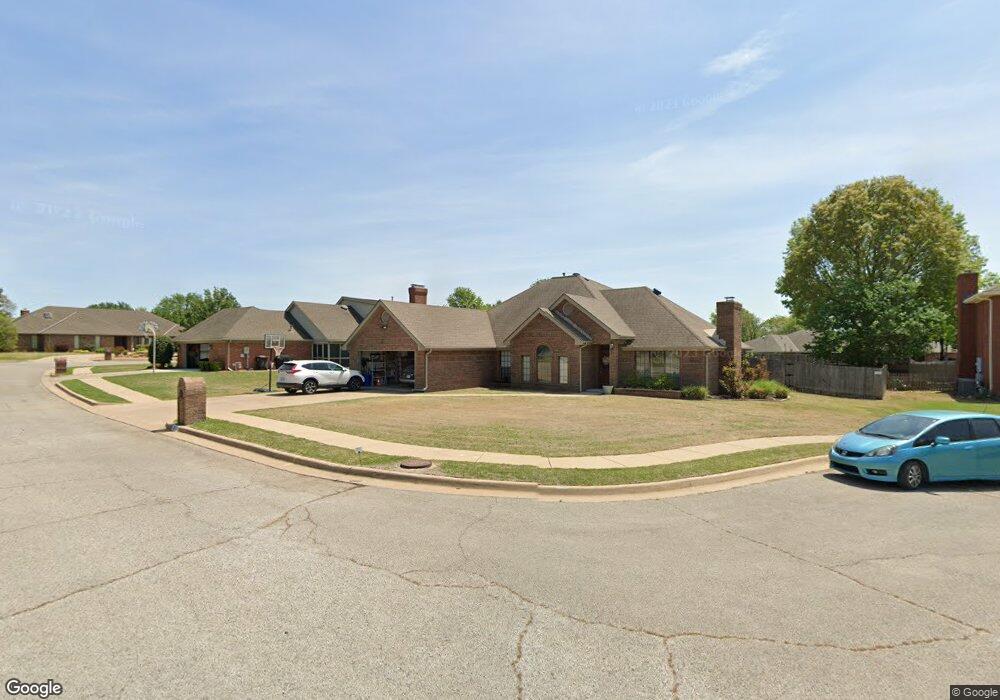
2613 Camelot Ct Bartlesville, OK 74006
Estimated Value: $331,224 - $398,000
3
Beds
3
Baths
3,170
Sq Ft
$117/Sq Ft
Est. Value
About This Home
This home is located at 2613 Camelot Ct, Bartlesville, OK 74006 and is currently estimated at $371,556, approximately $117 per square foot. 2613 Camelot Ct is a home located in Washington County with nearby schools including Wayside Elementary School, Central Middle School, and Bartlesville High School.
Ownership History
Date
Name
Owned For
Owner Type
Purchase Details
Closed on
Nov 21, 2017
Sold by
Morris Kent L and Morris Pamela K
Bought by
Morris Kent L and Morris Pamela K
Current Estimated Value
Purchase Details
Closed on
Aug 7, 2015
Sold by
Humphries William H and Humphries Katharine R
Bought by
Morris Kent Lavon and Morris Pamela Kim
Home Financials for this Owner
Home Financials are based on the most recent Mortgage that was taken out on this home.
Original Mortgage
$192,000
Outstanding Balance
$147,100
Interest Rate
3.37%
Mortgage Type
Adjustable Rate Mortgage/ARM
Estimated Equity
$224,456
Purchase Details
Closed on
Jan 17, 2013
Sold by
Humphries William H and Humphries Katharine R
Bought by
Humphries William H and Humphries Katharine R
Create a Home Valuation Report for This Property
The Home Valuation Report is an in-depth analysis detailing your home's value as well as a comparison with similar homes in the area
Home Values in the Area
Average Home Value in this Area
Purchase History
| Date | Buyer | Sale Price | Title Company |
|---|---|---|---|
| Morris Kent L | -- | None Available | |
| Morris Kent Lavon | $240,000 | None Available | |
| Humphries William H | -- | None Available |
Source: Public Records
Mortgage History
| Date | Status | Borrower | Loan Amount |
|---|---|---|---|
| Open | Morris Kent Lavon | $192,000 |
Source: Public Records
Tax History Compared to Growth
Tax History
| Year | Tax Paid | Tax Assessment Tax Assessment Total Assessment is a certain percentage of the fair market value that is determined by local assessors to be the total taxable value of land and additions on the property. | Land | Improvement |
|---|---|---|---|---|
| 2025 | $3,640 | $30,261 | $3,600 | $26,661 |
| 2024 | $3,640 | $31,307 | $3,000 | $28,307 |
| 2023 | $3,640 | $31,307 | $3,000 | $28,307 |
| 2022 | $3,630 | $31,307 | $3,000 | $28,307 |
| 2021 | $3,493 | $30,743 | $3,000 | $27,743 |
| 2020 | $3,464 | $29,848 | $3,000 | $26,848 |
| 2019 | $3,466 | $29,848 | $3,000 | $26,848 |
| 2018 | $3,448 | $29,848 | $3,000 | $26,848 |
| 2017 | $3,529 | $29,848 | $3,000 | $26,848 |
| 2016 | $3,265 | $28,441 | $3,000 | $25,441 |
| 2015 | $2,440 | $21,927 | $2,921 | $19,006 |
| 2014 | $2,431 | $21,927 | $2,921 | $19,006 |
Source: Public Records
Map
Nearby Homes
- 3201 Brighton Ln
- 2601 Rice Creek Rd
- 2549 Regency Rd
- 2408 Chapel Hill Ct
- 2516 Williamsburg St
- 2925 Claremont Dr
- 2527 Dorchester Dr
- 2801 Monticello Dr
- 2410 Dorchester Dr
- 2740 Montrose Dr
- 2708 Claremont Dr
- 2816 Roanoke Ridge Rd
- 2809 Kingston Ct
- 1811 Wayland Ct
- 0000 Highway 75
- 8 Starview Cir
- 15 Starview Cir
- 2 Blackstone Ct
- 1 Blackstone Ct
- 17 Silver Lake Rd
- 3205 Camelot Dr
- 3209 Camelot Dr
- 2612 Camelot Ct
- 2608 Camelot Ct
- 2605 Camelot Ct
- 2608 Kensington Way
- 2612 Kensington Way
- 2616 Camelot Ct
- 2616 Kensington Way
- 3204 Camelot Dr
- 2604 Kensington Way
- 2609 SE Vicksburg St
- 3208 Camelot Dr
- 2613 SE Vicksburg St
- 2605 SE Vicksburg St
- 3212 SE Brighton
- 3208 Brighton Ln
- 3204 Brighton Ln
- 3200 Camelot Dr
- 3212 Brighton Ln