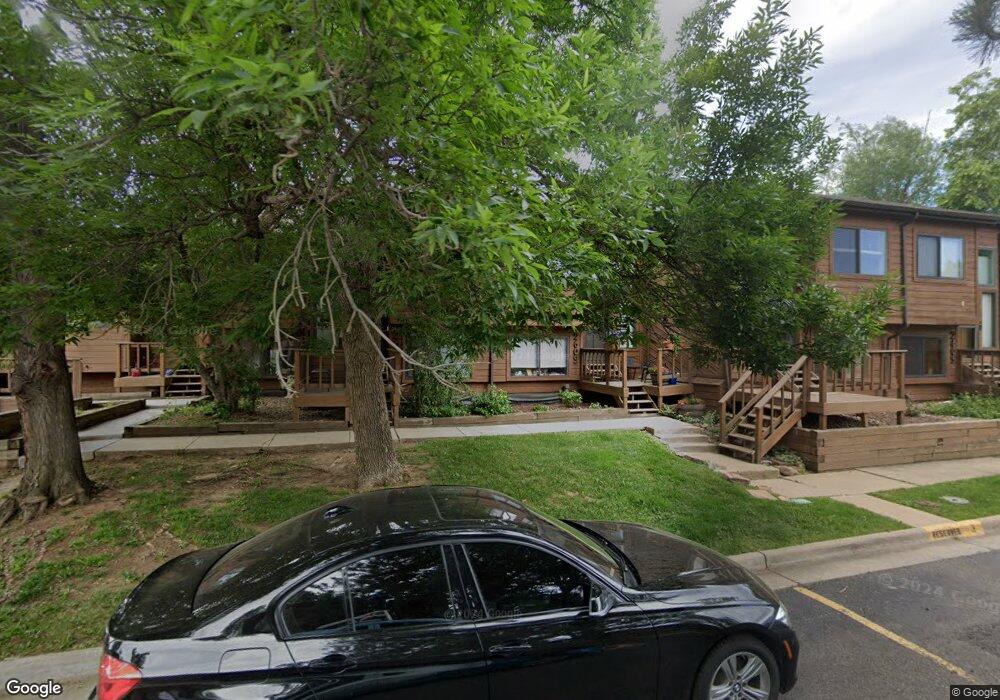
2613 Juniper Ave Unit 19 Boulder, CO 80304
North Boulder NeighborhoodEstimated Value: $476,000 - $590,000
2
Beds
1
Bath
1,042
Sq Ft
$517/Sq Ft
Est. Value
About This Home
This home is located at 2613 Juniper Ave Unit 19, Boulder, CO 80304 and is currently estimated at $538,952, approximately $517 per square foot. 2613 Juniper Ave Unit 19 is a home located in Boulder County with nearby schools including Columbine Elementary School, Centennial Middle School, and Boulder High School.
Ownership History
Date
Name
Owned For
Owner Type
Purchase Details
Closed on
Jan 14, 2003
Sold by
Cross Elizabeth S
Bought by
Cross Elizabeth S
Current Estimated Value
Home Financials for this Owner
Home Financials are based on the most recent Mortgage that was taken out on this home.
Original Mortgage
$193,800
Outstanding Balance
$83,520
Interest Rate
6.16%
Estimated Equity
$455,432
Purchase Details
Closed on
Oct 17, 2000
Sold by
L Cross Elizabeth S J and L Lorie
Bought by
Cross Elizabeth S
Home Financials for this Owner
Home Financials are based on the most recent Mortgage that was taken out on this home.
Original Mortgage
$192,000
Interest Rate
7.89%
Purchase Details
Closed on
Jul 28, 1995
Sold by
Harrington Jane Clement
Bought by
Cross Elizabeth S
Home Financials for this Owner
Home Financials are based on the most recent Mortgage that was taken out on this home.
Original Mortgage
$134,100
Interest Rate
7.51%
Purchase Details
Closed on
Jul 22, 1991
Bought by
Cross Elizabeth S and Carter Michael C
Purchase Details
Closed on
Jul 13, 1984
Bought by
Cross Elizabeth S and Carter Michael C
Create a Home Valuation Report for This Property
The Home Valuation Report is an in-depth analysis detailing your home's value as well as a comparison with similar homes in the area
Home Values in the Area
Average Home Value in this Area
Purchase History
| Date | Buyer | Sale Price | Title Company |
|---|---|---|---|
| Cross Elizabeth S | -- | -- | |
| Cross Elizabeth S | -- | -- | |
| Cross Elizabeth S | $149,000 | -- | |
| Cross Elizabeth S | $85,000 | -- | |
| Cross Elizabeth S | $83,000 | -- |
Source: Public Records
Mortgage History
| Date | Status | Borrower | Loan Amount |
|---|---|---|---|
| Open | Cross Elizabeth S | $193,800 | |
| Closed | Cross Elizabeth S | $192,000 | |
| Closed | Cross Elizabeth S | $134,100 |
Source: Public Records
Tax History
| Year | Tax Paid | Tax Assessment Tax Assessment Total Assessment is a certain percentage of the fair market value that is determined by local assessors to be the total taxable value of land and additions on the property. | Land | Improvement |
|---|---|---|---|---|
| 2025 | $2,470 | $32,169 | -- | $32,169 |
| 2024 | $2,470 | $32,169 | -- | $32,169 |
| 2023 | $2,427 | $28,105 | -- | $31,790 |
| 2022 | $2,605 | $28,057 | $0 | $28,057 |
| 2021 | $2,485 | $28,865 | $0 | $28,865 |
| 2020 | $2,521 | $28,958 | $0 | $28,958 |
| 2019 | $2,482 | $28,958 | $0 | $28,958 |
| 2018 | $2,189 | $25,243 | $0 | $25,243 |
| 2017 | $2,120 | $27,908 | $0 | $27,908 |
| 2016 | $1,867 | $21,572 | $0 | $21,572 |
| 2015 | $1,768 | $20,903 | $0 | $20,903 |
| 2014 | $1,758 | $20,903 | $0 | $20,903 |
Source: Public Records
Map
Nearby Homes
- 2636 Juniper Ave Unit 1
- 2409 Keystone Ct
- 2645 Tabriz Place Unit 22
- 2540 Iris Ave
- 3535 28th St Unit 101
- 3545 28th St Unit 304
- 3616 Roundtree Ct
- 3575 28th St Unit 104
- 2435 Hawthorn Ave
- 3737 26th St
- 3225 Arnett St
- 2800 Kalmia Ave Unit A306
- 2800 Kalmia Ave Unit A225
- 2800 Kalmia Ave Unit A310
- 2800 Kalmia Ave Unit A206
- 2800 Kalmia Ave Unit C103
- 2595 Glenwood Dr
- 2410 Grape Ave
- 2736 Winding Trail Place
- 3788 26th St
- 2615 Juniper Ave Unit 20
- 2611 Juniper Ave Unit 18
- 2609 Juniper Ave Unit 17
- 2605 Juniper Ave Unit 15
- 2607 Juniper Ave Unit 16
- 2603 Juniper Ave
- 2619 Juniper Ave
- 2635 Juniper Ave Unit 26
- 2629 Juniper Ave Unit 23
- 2627 Juniper Ave Unit 22
- 2625 Juniper Ave Unit 21
- 2621 Juniper Ave
- 2601 Juniper Ave
- 2631 Juniper Ave Unit 24
- 2633 Juniper Ave Unit 25
- 2633 Juniper Ave
- 2623 Juniper Ave
- 2661 Juniper Ave Unit 31
- 2657 Juniper Ave Unit 29
- 2655 Juniper Ave Unit 28
Your Personal Tour Guide
Ask me questions while you tour the home.