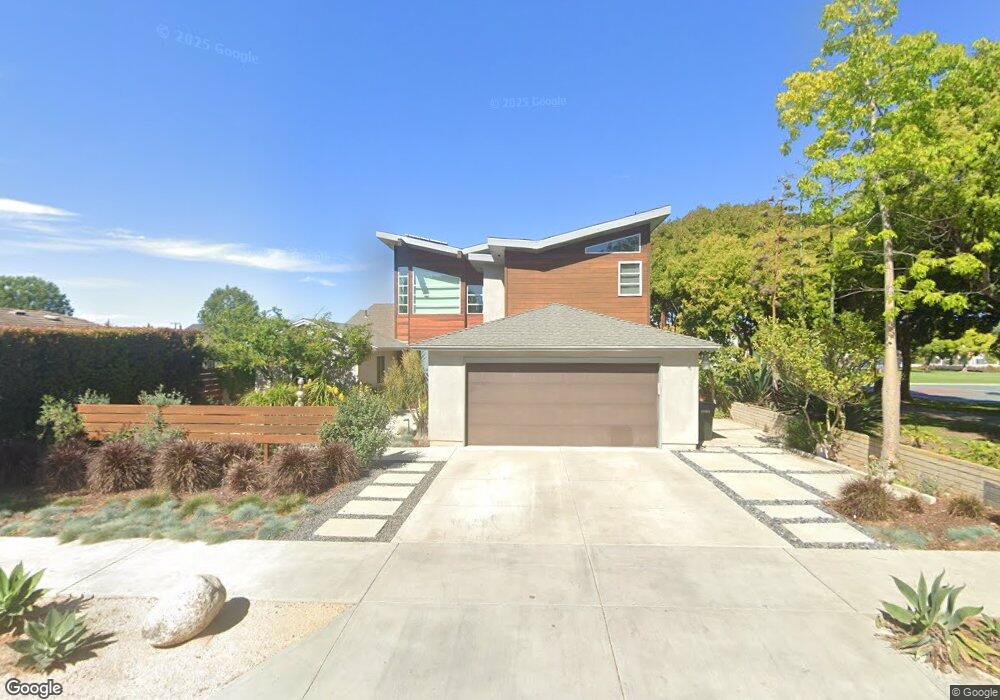
2613 Mesa Dr Newport Beach, CA 92660
Bayview NeighborhoodEstimated Value: $3,252,000 - $4,940,000
5
Beds
5
Baths
3,700
Sq Ft
$1,073/Sq Ft
Est. Value
About This Home
This home is located at 2613 Mesa Dr, Newport Beach, CA 92660 and is currently estimated at $3,971,091, approximately $1,073 per square foot. 2613 Mesa Dr is a home located in Orange County with nearby schools including Eastbluff Elementary School, Corona del Mar Middle and High School, and Newport Montessori School.
Ownership History
Date
Name
Owned For
Owner Type
Purchase Details
Closed on
Nov 21, 2022
Sold by
Wendland Lloyd P and Wendland Stacie R
Bought by
Wendland Trust
Current Estimated Value
Purchase Details
Closed on
Sep 5, 1995
Sold by
Cox Alvin E and Cox Nancy L
Bought by
Wendland Lloyd P and Wendland Stacie R
Home Financials for this Owner
Home Financials are based on the most recent Mortgage that was taken out on this home.
Original Mortgage
$277,200
Interest Rate
7.83%
Create a Home Valuation Report for This Property
The Home Valuation Report is an in-depth analysis detailing your home's value as well as a comparison with similar homes in the area
Home Values in the Area
Average Home Value in this Area
Purchase History
| Date | Buyer | Sale Price | Title Company |
|---|---|---|---|
| Wendland Trust | -- | -- | |
| Wendland Lloyd P | $346,500 | Old Republic Title Company |
Source: Public Records
Mortgage History
| Date | Status | Borrower | Loan Amount |
|---|---|---|---|
| Previous Owner | Wendland Lloyd P | $277,200 |
Source: Public Records
Tax History Compared to Growth
Tax History
| Year | Tax Paid | Tax Assessment Tax Assessment Total Assessment is a certain percentage of the fair market value that is determined by local assessors to be the total taxable value of land and additions on the property. | Land | Improvement |
|---|---|---|---|---|
| 2025 | $11,609 | $1,051,177 | $381,991 | $669,186 |
| 2024 | $11,609 | $1,030,566 | $374,501 | $656,065 |
| 2023 | $11,304 | $1,010,359 | $367,158 | $643,201 |
| 2022 | $11,086 | $990,549 | $359,959 | $630,590 |
| 2021 | $10,856 | $971,127 | $352,901 | $618,226 |
| 2020 | $10,738 | $961,170 | $349,283 | $611,887 |
| 2019 | $10,509 | $942,324 | $342,434 | $599,890 |
| 2018 | $10,297 | $923,848 | $335,720 | $588,128 |
| 2017 | $10,120 | $905,734 | $329,137 | $576,597 |
| 2016 | $9,899 | $887,975 | $322,683 | $565,292 |
| 2015 | $9,804 | $874,637 | $317,836 | $556,801 |
| 2014 | $9,578 | $857,505 | $311,610 | $545,895 |
Source: Public Records
Map
Nearby Homes
- 20391 Bayview Ave
- 57 Shearwater Place
- 2321 Mesa Dr
- 20382 SW Cypress St
- 43 Gannet Ln
- 20304 SW Cypress St
- 20431 SW Cypress St
- 20391 SW Cypress St
- 20171 Bayview Ave
- 2262 Orchard Dr
- 20211 Orchid St
- 2173 Orchard Dr
- 2987 Quedada
- 2901 Quedada
- 520 Cancha
- 3167 Corte Portofino
- 3107 Corte Caleta
- 311 Vista Suerte
- 3121 Corte Linda
- 2500 Anniversary Ln
- 2611 Mesa Dr
- 20452 Bayview Ave
- 20442 Bayview Ave
- 20422 Bayview Ave
- 2612 Mesa Dr
- 99 Pelican Ct
- 20461 Bayview Ave
- 2431 Mesa Dr
- 97 Pelican Ct
- 20451 Bayview Ave
- 20412 Bayview Ave
- 95 Pelican Ct
- 20441 Bayview Ave
- 93 Pelican Ct
- 20421 Bayview Ave
- 20402 Bayview Ave
- 91 Pelican Ct
- 70 Cormorant Cir
- 20475 Upper Bay Dr
- 20491 Upper Bay Dr