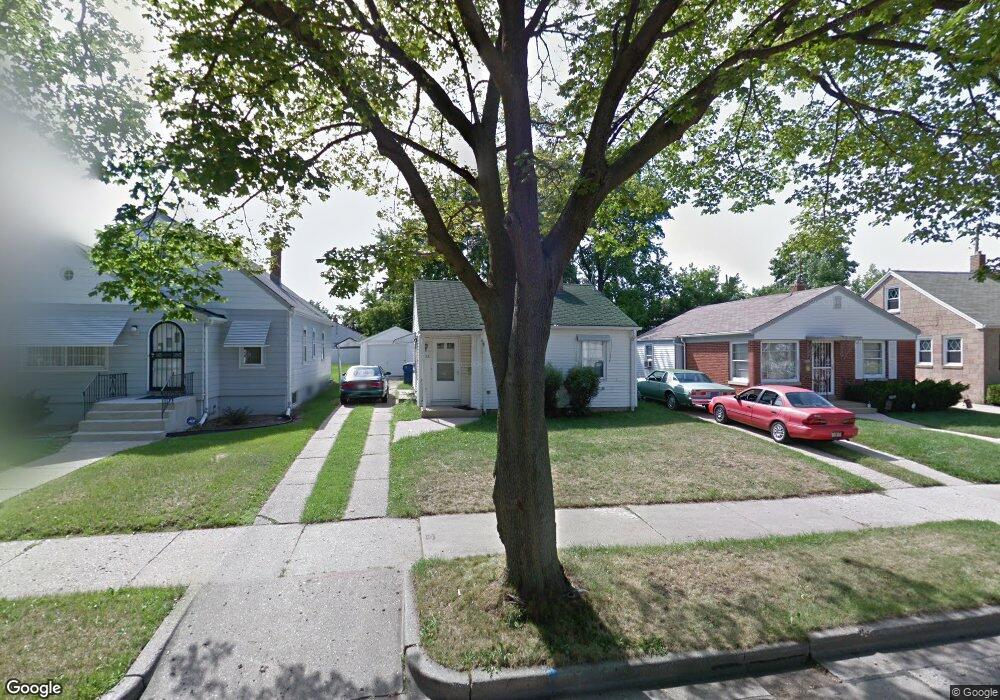
2613 N 58th St Milwaukee, WI 53210
Uptown Milwaukee NeighborhoodEstimated Value: $95,000 - $144,000
2
Beds
1
Bath
713
Sq Ft
$159/Sq Ft
Est. Value
About This Home
This home is located at 2613 N 58th St, Milwaukee, WI 53210 and is currently estimated at $113,177, approximately $158 per square foot. 2613 N 58th St is a home located in Milwaukee County with nearby schools including Milwaukee German Immersion School, Craig Montessori School, and La Escuela Fratney.
Ownership History
Date
Name
Owned For
Owner Type
Purchase Details
Closed on
Dec 12, 2023
Sold by
Moore & Moore Properties Llc
Bought by
Mindstar Investments Llc
Current Estimated Value
Purchase Details
Closed on
Jul 17, 2018
Sold by
Moore Darryl A and Moore Cottrina L
Bought by
Moore Moore Properties Llc
Home Financials for this Owner
Home Financials are based on the most recent Mortgage that was taken out on this home.
Original Mortgage
$135,750
Interest Rate
4.6%
Mortgage Type
New Conventional
Purchase Details
Closed on
Jun 1, 2016
Sold by
City Of Milwaukee
Bought by
Moore Darryl A and Moore Cottrina L
Purchase Details
Closed on
Jul 7, 2006
Sold by
Sass Rick
Bought by
Howard Fred L and Howard Veronica
Home Financials for this Owner
Home Financials are based on the most recent Mortgage that was taken out on this home.
Original Mortgage
$83,300
Interest Rate
10.85%
Mortgage Type
Purchase Money Mortgage
Create a Home Valuation Report for This Property
The Home Valuation Report is an in-depth analysis detailing your home's value as well as a comparison with similar homes in the area
Home Values in the Area
Average Home Value in this Area
Purchase History
| Date | Buyer | Sale Price | Title Company |
|---|---|---|---|
| Mindstar Investments Llc | $79,900 | None Listed On Document | |
| Moore Moore Properties Llc | $135,800 | None Available | |
| Moore Darryl A | $5,000 | None Available | |
| Howard Fred L | $83,300 | None Available |
Source: Public Records
Mortgage History
| Date | Status | Borrower | Loan Amount |
|---|---|---|---|
| Previous Owner | Moore Moore Properties Llc | $135,750 | |
| Previous Owner | Howard Fred L | $83,300 |
Source: Public Records
Tax History Compared to Growth
Tax History
| Year | Tax Paid | Tax Assessment Tax Assessment Total Assessment is a certain percentage of the fair market value that is determined by local assessors to be the total taxable value of land and additions on the property. | Land | Improvement |
|---|---|---|---|---|
| 2024 | $2,020 | $91,900 | $7,000 | $84,900 |
| 2023 | $1,711 | $72,400 | $7,000 | $65,400 |
| 2022 | $1,650 | $72,400 | $7,000 | $65,400 |
| 2021 | $1,791 | $70,800 | $7,000 | $63,800 |
| 2020 | $1,778 | $70,800 | $7,000 | $63,800 |
| 2019 | $1,360 | $53,500 | $18,000 | $35,500 |
| 2018 | $1,317 | $53,500 | $18,000 | $35,500 |
| 2017 | $1,390 | $49,900 | $14,400 | $35,500 |
| 2016 | $0 | $58,700 | $14,400 | $44,300 |
| 2015 | $1,642 | $58,700 | $14,400 | $44,300 |
| 2014 | $1,679 | $58,700 | $14,400 | $44,300 |
| 2013 | -- | $58,700 | $14,400 | $44,300 |
Source: Public Records
Map
Nearby Homes
- 2547 N 56th St
- 5920 W Center St
- 2726 N 58th St
- 2721 N 59th St
- 2639 N 61st St Unit 2641
- 2726 N 56th St
- 2741 N 56th St
- 6040 W Lisbon Ave
- 2435 N 57th St
- 2750 N 61st St
- 2751 N 55th St
- 2401 N 53rd St
- 2432 N 55th St
- 2426 N 55th St
- 2844 N 57th St
- 2546 N 53rd St
- 2854 N 58th St Unit 2856
- 2338 N 58th St
- 5230 W Lisbon Ave
- 2878 N 57th St Unit 2880
- 2609 N 58th St
- 2619 N 58th St
- 2603 N 58th St Unit 2605
- 2625 N 58th St
- 2614 N 59th St
- 2618 N 59th St Unit 2620
- 2628-2630 N 59th St Unit 2
- 2606 N 59th St
- 5801 W Lisbon Ave
- 2624 N 59th St
- 5811 W Lisbon Ave
- 2628 N 59th St Unit 2630
- 2579 N 58th St
- 2634 N 59th St
- 2576 N 59th St
- 2573 N 58th St
- 2572 N 59th St
- 2578 N 58th St
- 2567 N 58th St
- 2572 N 58th St