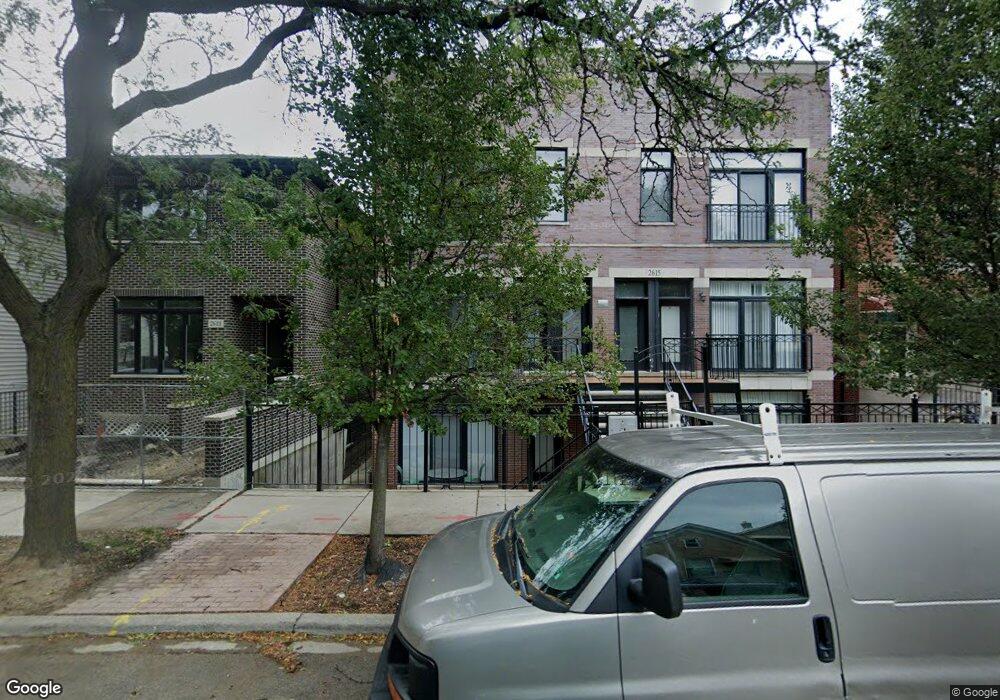
2613 S Lowe Ave Unit 3N Chicago, IL 60616
Bridgeport NeighborhoodEstimated Value: $294,840 - $422,000
3
Beds
2
Baths
1,300
Sq Ft
$264/Sq Ft
Est. Value
About This Home
This home is located at 2613 S Lowe Ave Unit 3N, Chicago, IL 60616 and is currently estimated at $342,960, approximately $263 per square foot. 2613 S Lowe Ave Unit 3N is a home located in Cook County with nearby schools including Healy Elementary School, St. Jerome Catholic School, and St Therese School.
Ownership History
Date
Name
Owned For
Owner Type
Purchase Details
Closed on
Nov 13, 2009
Sold by
Tam Man Fai
Bought by
Tam Man Fai and Ha Tam Mei
Current Estimated Value
Purchase Details
Closed on
Oct 5, 2006
Sold by
2613-15 South Lowe Llc
Bought by
Tam Man Fai
Create a Home Valuation Report for This Property
The Home Valuation Report is an in-depth analysis detailing your home's value as well as a comparison with similar homes in the area
Home Values in the Area
Average Home Value in this Area
Purchase History
| Date | Buyer | Sale Price | Title Company |
|---|---|---|---|
| Tam Man Fai | -- | None Available | |
| Tam Man Fai | $294,000 | Ct |
Source: Public Records
Tax History Compared to Growth
Tax History
| Year | Tax Paid | Tax Assessment Tax Assessment Total Assessment is a certain percentage of the fair market value that is determined by local assessors to be the total taxable value of land and additions on the property. | Land | Improvement |
|---|---|---|---|---|
| 2024 | $4,342 | $30,859 | $5,595 | $25,264 |
| 2023 | $4,211 | $23,895 | $4,517 | $19,378 |
| 2022 | $4,211 | $23,895 | $4,517 | $19,378 |
| 2021 | $4,135 | $23,894 | $4,516 | $19,378 |
| 2020 | $4,235 | $22,113 | $4,516 | $17,597 |
| 2019 | $4,283 | $24,747 | $4,516 | $20,231 |
| 2018 | $4,210 | $24,747 | $4,516 | $20,231 |
| 2017 | $4,043 | $22,157 | $3,592 | $18,565 |
| 2016 | $4,721 | $26,067 | $3,592 | $22,475 |
| 2015 | $4,826 | $28,962 | $3,592 | $25,370 |
| 2014 | $3,364 | $20,699 | $4,362 | $16,337 |
| 2013 | $3,286 | $20,699 | $4,362 | $16,337 |
Source: Public Records
Map
Nearby Homes
- 2612 S Lowe Ave
- 2543 S Wallace St Unit 11
- 511 W 25th Place
- 2628 S Union Ave
- 2567 S Emerald Ave
- 459 W 26th St
- 3255 S Canal St
- 2807 S Halsted St Unit 201
- 2807 S Halsted St Unit 205
- 2807 S Halsted St Unit 204
- 2828 S Emerald Ave
- 2849 S Normal Ave
- 2906 S Lowe Ave
- 475 W 24th St Unit 2A
- 310 W 24th Place
- 450 W 29th St
- 2929 S Wallace St
- 349 W 26th St
- 2958 S Lowe Ave
- 2631 S Shields Ave
- 2613 S Lowe Ave Unit 2N
- 2613 S Lowe Ave Unit 1N
- 2613 S Lowe Ave Unit 1
- 2615 S Lowe Ave Unit 1S
- 2615 S Lowe Ave Unit 3S
- 2619 S Lowe Ave
- 2623 S Lowe Ave
- 2609 S Lowe Ave
- 2625 S Lowe Ave Unit 2
- 2607 S Lowe Ave
- 2627 S Lowe Ave
- 2605 S Lowe Ave Unit 3
- 2605 S Lowe Ave Unit 2
- 2605 S Lowe Ave Unit 1
- 2631 S Lowe Ave
- 2618 S Wallace St
- 2601 S Lowe Ave Unit C
- 2601 S Lowe Ave
- 2601 S Lowe Ave