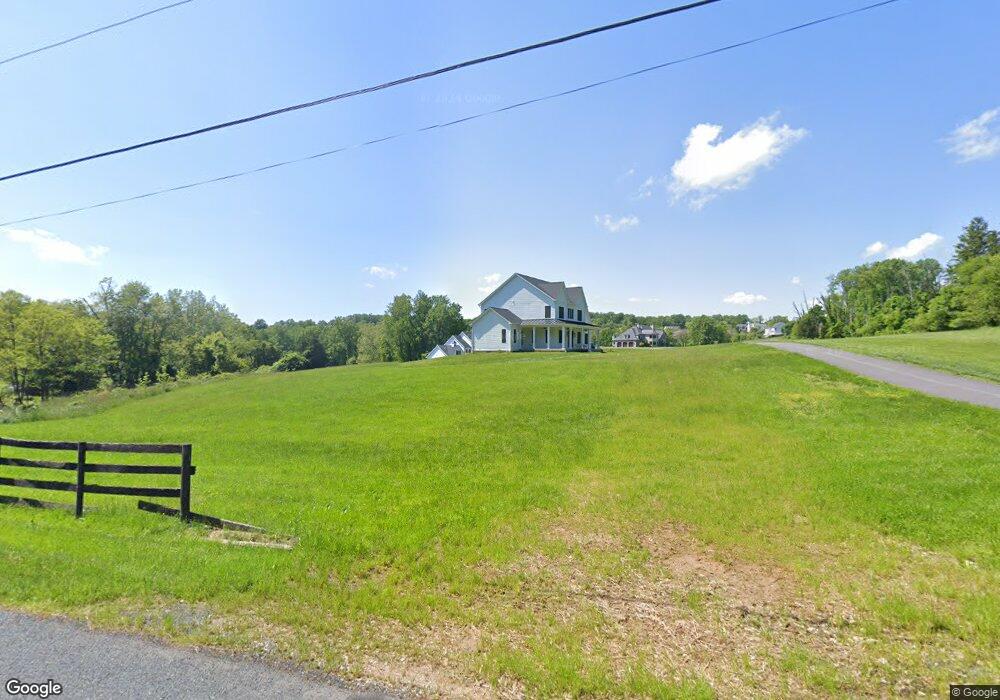
2614 Laurel Brook Rd Fallston, MD 21047
Estimated Value: $1,563,000 - $2,740,000
Studio
5
Baths
6,686
Sq Ft
$343/Sq Ft
Est. Value
About This Home
This home is located at 2614 Laurel Brook Rd, Fallston, MD 21047 and is currently estimated at $2,291,073, approximately $342 per square foot. 2614 Laurel Brook Rd is a home located in Harford County with nearby schools including Youths Benefit Elementary School, Fallston Middle School, and Fallston High School.
Ownership History
Date
Name
Owned For
Owner Type
Purchase Details
Closed on
Jun 3, 2024
Sold by
Procheska William M and Procheska Angela A
Bought by
Mosier Craig A and Mosier Jennifer C
Current Estimated Value
Purchase Details
Closed on
Dec 17, 2015
Sold by
Procheska William M and Procheska Angela A
Bought by
Martin Helen E
Purchase Details
Closed on
Dec 18, 2013
Sold by
Fallston Meadows Llc
Bought by
Procheska William M and Procheska Angela A
Home Financials for this Owner
Home Financials are based on the most recent Mortgage that was taken out on this home.
Original Mortgage
$1,708,500
Interest Rate
3.87%
Mortgage Type
Adjustable Rate Mortgage/ARM
Purchase Details
Closed on
May 19, 2000
Sold by
Neiser Ida J
Bought by
Deigert Joseph D
Create a Home Valuation Report for This Property
The Home Valuation Report is an in-depth analysis detailing your home's value as well as a comparison with similar homes in the area
Home Values in the Area
Average Home Value in this Area
Purchase History
| Date | Buyer | Sale Price | Title Company |
|---|---|---|---|
| Mosier Craig A | $2,575,000 | Sage Title | |
| Mosier Craig A | $2,575,000 | Sage Title | |
| Martin Helen E | -- | Getz Title Group Llc | |
| Procheska William M | $560,000 | Getz Title Group Llc | |
| Deigert Joseph D | $75,200 | -- |
Source: Public Records
Mortgage History
| Date | Status | Borrower | Loan Amount |
|---|---|---|---|
| Previous Owner | Procheska William M | $1,708,500 |
Source: Public Records
Tax History
| Year | Tax Paid | Tax Assessment Tax Assessment Total Assessment is a certain percentage of the fair market value that is determined by local assessors to be the total taxable value of land and additions on the property. | Land | Improvement |
|---|---|---|---|---|
| 2025 | $17,741 | $1,680,600 | $260,300 | $1,420,300 |
| 2024 | $17,681 | $1,622,267 | $0 | $0 |
| 2023 | $17,045 | $1,563,933 | $0 | $0 |
| 2022 | $7,805 | $1,579,000 | $333,700 | $1,245,300 |
| 2021 | $9,840 | $1,630,100 | $384,800 | $1,245,300 |
| 2020 | $9,840 | $1,708,600 | $463,300 | $1,245,300 |
| 2019 | $18,949 | $1,756,800 | $413,300 | $1,343,500 |
| 2018 | $17,850 | $1,638,800 | $0 | $0 |
| 2017 | $16,958 | $1,756,800 | $0 | $0 |
| 2016 | -- | $1,402,800 | $0 | $0 |
| 2015 | $3,243 | $267,300 | $0 | $0 |
| 2014 | $3,243 | $273,600 | $0 | $0 |
Source: Public Records
Map
Nearby Homes
- 1319 Martin Meadows Dr
- 700 Remington Rd
- 1709 D Laurel Brook Rd
- 1709 B Laurel Brook Rd
- 1410 A Falls Crest Dr
- 2509 Port Ln
- 2517 Port Ln
- 2208 Arden Dr
- 2124 Oaklyn Dr
- 2204 Arden Dr
- 1115 Stromko Dr
- 2114 Oaklyn Dr
- 2511 Easy St
- 2005 Pearlstone Dr
- 2210 Pleasantville Rd
- 2015 Margrave Ave
- 305 Tufton Cir
- 371 Tufton Cir
- 1201 N Tollgate Rd
- 309 Lennox Dr
- 2622 Laurel Brook Rd
- 2602 Laurel Brook Rd
- 2608 Laurel Brook Rd
- 1420 Martin Meadows Dr
- 2604 Laurel Brook Rd
- 2700 Laurel Brook Rd
- 2607 Laurel View Ct
- 2618 Laurel Brook Rd
- 1418 Martin Meadows Dr
- 2606 Laurel View Ct
- 2600 Laurel Brook Rd
- 2596 Laurel Brook Rd
- 2598 Laurel Brook Rd
- 1429 Martin Meadows Dr
- 2605 Laurel View Ct
- 1427 Martin Meadows Dr
- 1435 Martin Meadows Dr
- 2607 Laurel Brook Rd
- 2601 Laurel Brook Rd
- 2625 Laurel Brook Rd
Your Personal Tour Guide
Ask me questions while you tour the home.