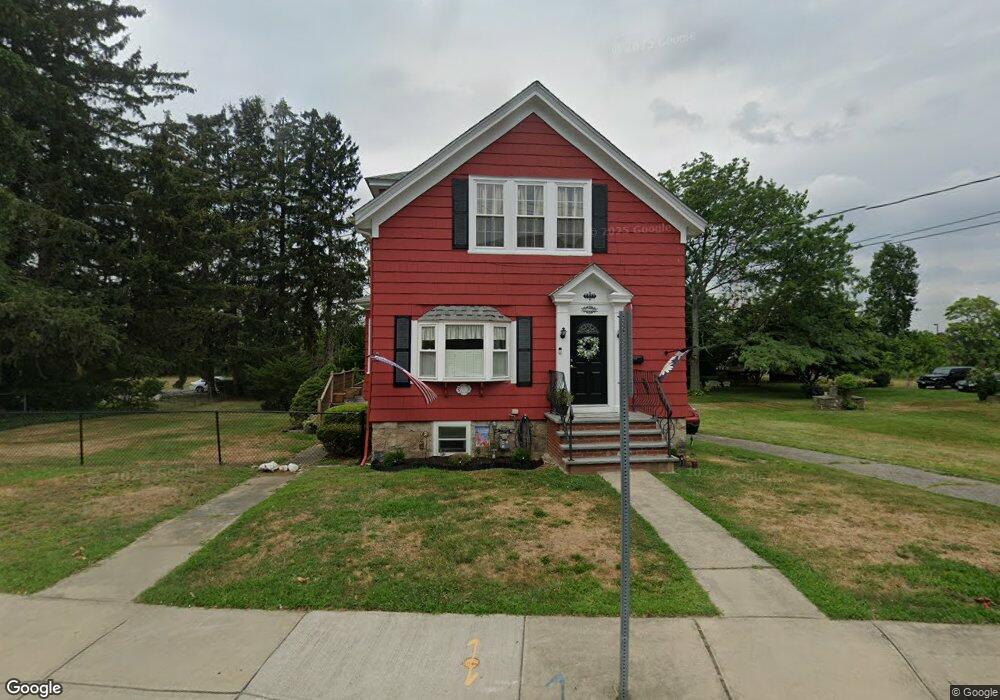
2614 N Main St Fall River, MA 02720
Western Fall River NeighborhoodEstimated Value: $381,000 - $470,000
3
Beds
2
Baths
1,841
Sq Ft
$233/Sq Ft
Est. Value
About This Home
This home is located at 2614 N Main St, Fall River, MA 02720 and is currently estimated at $428,254, approximately $232 per square foot. 2614 N Main St is a home located in Bristol County with nearby schools including North End Elementary School, Morton Middle School, and B M C Durfee High School.
Ownership History
Date
Name
Owned For
Owner Type
Purchase Details
Closed on
Mar 29, 2018
Sold by
Latour Linda M
Bought by
Latour Ft
Current Estimated Value
Purchase Details
Closed on
Aug 12, 1980
Bought by
Latour Denis J and Latour Linda M
Create a Home Valuation Report for This Property
The Home Valuation Report is an in-depth analysis detailing your home's value as well as a comparison with similar homes in the area
Home Values in the Area
Average Home Value in this Area
Purchase History
| Date | Buyer | Sale Price | Title Company |
|---|---|---|---|
| Latour Ft | -- | -- | |
| Latour Denis J | $30,000 | -- |
Source: Public Records
Mortgage History
| Date | Status | Borrower | Loan Amount |
|---|---|---|---|
| Previous Owner | Latour Denis J | $125,000 | |
| Previous Owner | Latour Denis J | $63,000 | |
| Previous Owner | Latour Denis J | $60,000 |
Source: Public Records
Tax History Compared to Growth
Tax History
| Year | Tax Paid | Tax Assessment Tax Assessment Total Assessment is a certain percentage of the fair market value that is determined by local assessors to be the total taxable value of land and additions on the property. | Land | Improvement |
|---|---|---|---|---|
| 2025 | $3,856 | $336,800 | $135,700 | $201,100 |
| 2024 | $3,641 | $316,900 | $130,600 | $186,300 |
| 2023 | $3,378 | $275,300 | $111,900 | $163,400 |
| 2022 | $3,126 | $247,700 | $101,800 | $145,900 |
| 2021 | $2,944 | $212,900 | $94,200 | $118,700 |
| 2020 | $2,945 | $203,800 | $90,100 | $113,700 |
| 2019 | $2,826 | $193,800 | $85,800 | $108,000 |
| 2018 | $2,670 | $182,600 | $84,200 | $98,400 |
| 2017 | $2,569 | $183,500 | $85,900 | $97,600 |
| 2016 | $2,487 | $182,500 | $89,500 | $93,000 |
| 2015 | $2,344 | $179,200 | $86,200 | $93,000 |
| 2014 | $2,311 | $183,700 | $90,700 | $93,000 |
Source: Public Records
Map
Nearby Homes
- 172 Gibbs St
- 1810 Highland Ave Unit 22
- 2022-2030 Highland Ave
- 409 Crescent St
- 104 Corbett St
- 203 Martha St
- 29 Valentine St
- 3216 N Main St
- 3226 N Main St Unit 1
- 195 Crescent St Unit 2
- 1146 Ray St
- 1928 N Main St Unit 4
- Parcel 2 Highcrest Rd
- 274 Archer St
- 122 Stowe St Unit 122
- 120 Stowe St Unit 120
- 110 Stowe St Unit 110
- 108 Stowe St Unit 108
- 26 Goddard St
- 50 Clark St Unit 19