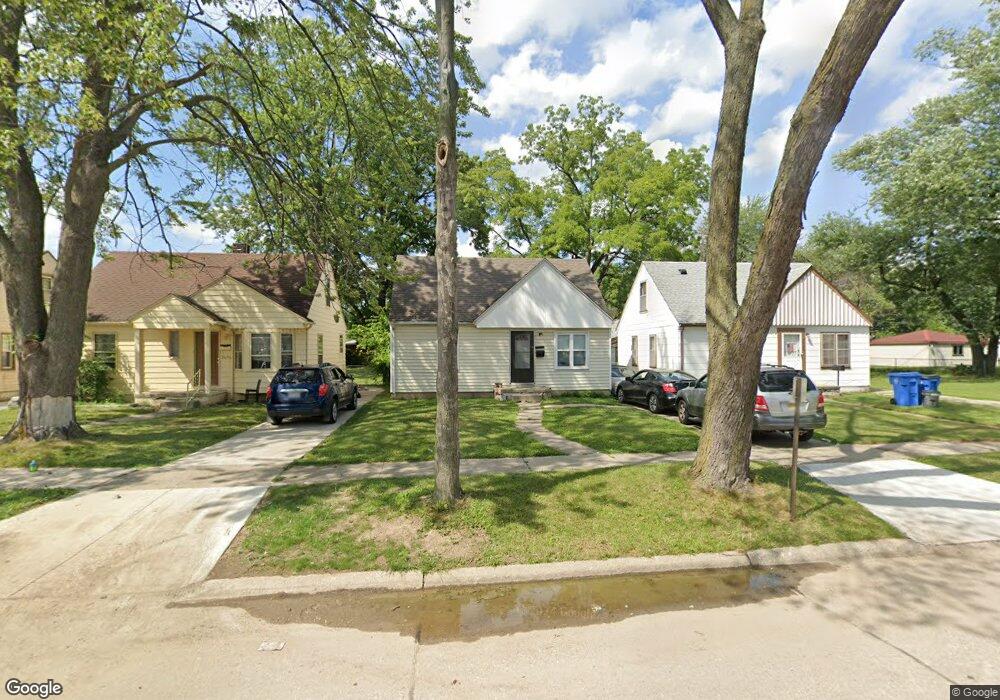
26140 Currier St Dearborn Heights, MI 48125
Estimated Value: $135,000 - $187,000
4
Beds
1
Bath
1,080
Sq Ft
$145/Sq Ft
Est. Value
About This Home
This home is located at 26140 Currier St, Dearborn Heights, MI 48125 and is currently estimated at $156,790, approximately $145 per square foot. 26140 Currier St is a home located in Wayne County with nearby schools including Quest Charter Academy, West Village Academy, and Peterson-Warren Academy.
Ownership History
Date
Name
Owned For
Owner Type
Purchase Details
Closed on
Dec 28, 2018
Sold by
Jsrr Funding Llc
Bought by
Gonzalez Jose and Gonzalez Luz Maria
Current Estimated Value
Purchase Details
Closed on
Dec 22, 2014
Sold by
Etc
Bought by
Jsr Funding Llc
Purchase Details
Closed on
Oct 31, 2014
Sold by
Fleisher Randall
Bought by
Etc and Wendy Duthie Stacey Ira
Purchase Details
Closed on
Mar 29, 2012
Sold by
Quadrant Residential Capital I Llc
Bought by
Gonzalez Jose
Purchase Details
Closed on
Nov 18, 2010
Sold by
Douglas David and Douglas Pammela R
Bought by
Quadrant Residential Capital I Llc
Purchase Details
Closed on
Nov 15, 2004
Sold by
Beaty Michael L and Beaty Annette
Bought by
Douglas David
Purchase Details
Closed on
Dec 23, 2003
Sold by
Benninger Michael G and Mcnulty Kathleen S
Bought by
Beaty Michael L
Create a Home Valuation Report for This Property
The Home Valuation Report is an in-depth analysis detailing your home's value as well as a comparison with similar homes in the area
Home Values in the Area
Average Home Value in this Area
Purchase History
| Date | Buyer | Sale Price | Title Company |
|---|---|---|---|
| Gonzalez Jose | $30,000 | None Available | |
| Jsr Funding Llc | $14,000 | None Available | |
| Etc | -- | None Available | |
| Etc | $500 | None Available | |
| Gonzalez Jose | -- | None Available | |
| Quadrant Residential Capital I Llc | $15,900 | None Available | |
| Douglas David | $87,800 | Multiple | |
| Beaty Michael L | $56,000 | Multiple | |
| Beaty Michael L | -- | Stewart Title |
Source: Public Records
Tax History Compared to Growth
Tax History
| Year | Tax Paid | Tax Assessment Tax Assessment Total Assessment is a certain percentage of the fair market value that is determined by local assessors to be the total taxable value of land and additions on the property. | Land | Improvement |
|---|---|---|---|---|
| 2025 | $1,400 | $61,900 | $0 | $0 |
| 2024 | $1,400 | $51,500 | $0 | $0 |
| 2023 | $2,366 | $44,300 | $0 | $0 |
| 2022 | $3,044 | $37,400 | $0 | $0 |
| 2021 | $2,728 | $31,700 | $0 | $0 |
| 2019 | $2,555 | $24,600 | $0 | $0 |
| 2018 | $2,475 | $22,800 | $0 | $0 |
| 2017 | $970 | $22,200 | $0 | $0 |
| 2016 | $2,260 | $22,500 | $0 | $0 |
| 2015 | $2,090 | $20,900 | $0 | $0 |
| 2013 | $2,260 | $23,500 | $0 | $0 |
| 2010 | -- | $27,200 | $0 | $0 |
Source: Public Records
Map
Nearby Homes
- 26106 Powers Ave
- 25926 Powers Ave
- 26225 McDonald St
- 25965 Currier St
- 26532 Powers Ave
- 25895 Annapolis St
- 25628 Powers Ave
- 4863 Glenis St
- 26439 Hopkins St
- 26458 Hopkins St
- 5845 Beech Daly Rd
- 26159 Stanford St
- 5961 Marvin St
- 5842 Janet St
- 25474 McDonald St
- 5961 Beech Daly Rd
- 5172 Hazel St
- 5993 John Daly St
- 5970 John Daly St
- 5904 Janet St
- 26150 Currier St
- 26130 Currier St
- 26160 Currier St
- VACANT Currier
- 26155 Powers Ave
- 26165 Powers Ave
- 26125 Powers Ave
- 26175 Powers Ave
- 26115 Powers Ave
- 26141 Currier St
- 26131 Currier St
- 26151 Currier St Unit Bldg-Unit
- 26151 Currier St
- 26121 Currier St
- 26161 Currier St
- 26105 Powers Ave
- 26171 Currier St
- 26111 Currier St
- 26101 Currier St
- 26095 Powers Ave