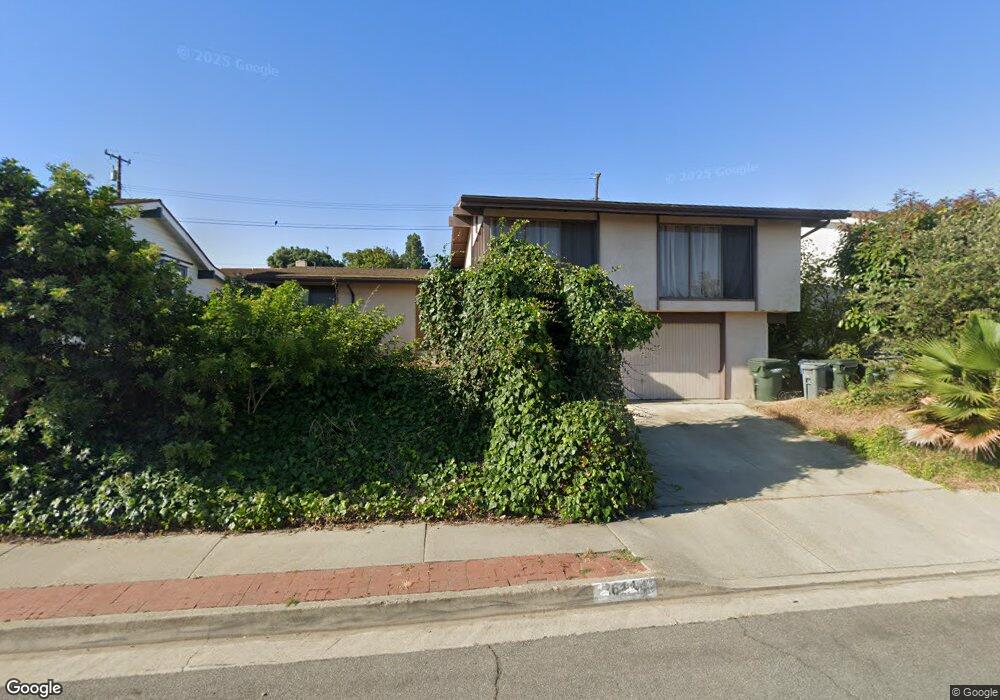
26144 Barkstone Dr Rancho Palos Verdes, CA 90275
Estimated Value: $1,785,435 - $2,224,000
4
Beds
2
Baths
2,116
Sq Ft
$924/Sq Ft
Est. Value
About This Home
This home is located at 26144 Barkstone Dr, Rancho Palos Verdes, CA 90275 and is currently estimated at $1,955,359, approximately $924 per square foot. 26144 Barkstone Dr is a home located in Los Angeles County with nearby schools including Silver Spur Elementary School, Palos Verdes Intermediate School, and Palos Verdes Peninsula High School.
Ownership History
Date
Name
Owned For
Owner Type
Purchase Details
Closed on
Dec 1, 2009
Sold by
Quong Janet
Bought by
Quong James
Current Estimated Value
Home Financials for this Owner
Home Financials are based on the most recent Mortgage that was taken out on this home.
Original Mortgage
$938,250
Interest Rate
4.77%
Mortgage Type
Reverse Mortgage Home Equity Conversion Mortgage
Purchase Details
Closed on
Nov 6, 2009
Sold by
Quong Russell and The Janet Quong Rpv House Trus
Bought by
Quong James
Home Financials for this Owner
Home Financials are based on the most recent Mortgage that was taken out on this home.
Original Mortgage
$938,250
Interest Rate
4.77%
Mortgage Type
Reverse Mortgage Home Equity Conversion Mortgage
Purchase Details
Closed on
Jan 19, 2007
Sold by
Quong Janet Y
Bought by
Quong Russell and Janet Quong Rpv House Trust
Create a Home Valuation Report for This Property
The Home Valuation Report is an in-depth analysis detailing your home's value as well as a comparison with similar homes in the area
Home Values in the Area
Average Home Value in this Area
Purchase History
| Date | Buyer | Sale Price | Title Company |
|---|---|---|---|
| Quong James | -- | Accommodation | |
| Quong James | -- | First American Title Ins Co | |
| Quong Russell | -- | None Available |
Source: Public Records
Mortgage History
| Date | Status | Borrower | Loan Amount |
|---|---|---|---|
| Closed | Quong James | $938,250 |
Source: Public Records
Tax History Compared to Growth
Tax History
| Year | Tax Paid | Tax Assessment Tax Assessment Total Assessment is a certain percentage of the fair market value that is determined by local assessors to be the total taxable value of land and additions on the property. | Land | Improvement |
|---|---|---|---|---|
| 2025 | $2,722 | $155,381 | $70,335 | $85,046 |
| 2024 | $2,722 | $152,335 | $68,956 | $83,379 |
| 2023 | $2,559 | $149,349 | $67,604 | $81,745 |
| 2022 | $2,403 | $146,422 | $66,279 | $80,143 |
| 2021 | $2,398 | $143,552 | $64,980 | $78,572 |
| 2019 | $2,306 | $139,296 | $63,053 | $76,243 |
| 2018 | $2,220 | $136,566 | $61,817 | $74,749 |
| 2016 | $2,093 | $131,265 | $59,417 | $71,848 |
| 2015 | $2,152 | $129,294 | $58,525 | $70,769 |
| 2014 | $2,139 | $126,762 | $57,379 | $69,383 |
Source: Public Records
Map
Nearby Homes
- 702 Via la Cuesta
- 5 Yellow Brick Rd
- 6045 Montemalaga Dr
- 6039 Via Sonoma
- 2521 Novato Place
- 2708 Via Elevado
- 5508 Ironwood St
- 26228 Birchfield Ave
- 26326 Birchfield Ave
- 1133 Granvia Altamira
- 1300 Granvia Altamira
- 2457 Via Sonoma
- 2505 Via Pinale
- 1325 Via Gabriel
- 2545 Via Campesina Unit 306
- 2417 Via Campesina Unit 2
- 869 Rincon Ln
- 229 Palos Verdes Dr W
- 2205 Via la Brea
- 728 Calle de Arboles
- 26138 Barkstone Dr
- 26150 Barkstone Dr
- 5747 Wildbriar Dr
- 26132 Barkstone Dr
- 5753 Wildbriar Dr
- 5739 Wildbriar Dr
- 5733 Wildbriar Dr
- 26126 Barkstone Dr
- 26145 Barkstone Dr
- 26139 Barkstone Dr
- 26151 Barkstone Dr
- 26131 Barkstone Dr
- 5727 Wildbriar Dr
- 26167 Barkstone Dr
- 26120 Barkstone Dr
- 26177 Barkstone Dr
- 26161 Barkstone Dr
- 26125 Barkstone Dr
- 26185 Barkstone Dr
- 26157 Barkstone Dr