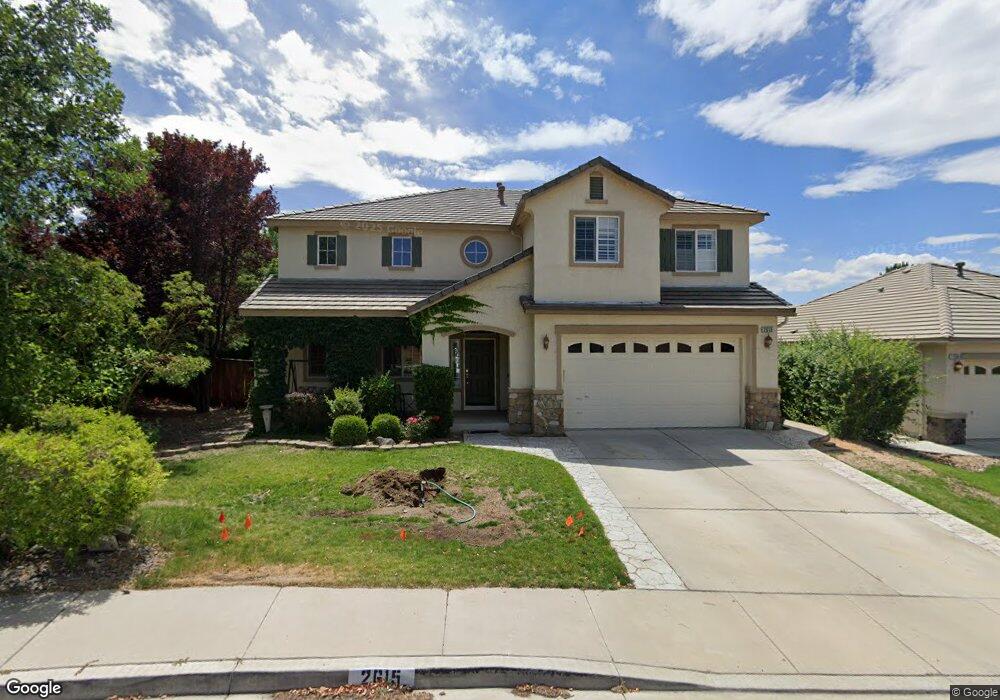
2615 Cosimo Ct Sparks, NV 89434
D'Andrea NeighborhoodEstimated Value: $681,665 - $733,000
3
Beds
3
Baths
2,953
Sq Ft
$238/Sq Ft
Est. Value
About This Home
This home is located at 2615 Cosimo Ct, Sparks, NV 89434 and is currently estimated at $702,916, approximately $238 per square foot. 2615 Cosimo Ct is a home located in Washoe County with nearby schools including Marvin Moss Elementary School, Lou Mendive Middle School, and Edward C Reed High School.
Ownership History
Date
Name
Owned For
Owner Type
Purchase Details
Closed on
Jun 27, 2019
Sold by
Macva Michael G and Refalo Maeva Laura A
Bought by
Maeva Michael G and Refalo Maeva Laura A
Current Estimated Value
Home Financials for this Owner
Home Financials are based on the most recent Mortgage that was taken out on this home.
Original Mortgage
$221,000
Outstanding Balance
$193,100
Interest Rate
4%
Mortgage Type
New Conventional
Estimated Equity
$509,816
Purchase Details
Closed on
Jul 14, 2005
Sold by
Maeva Michael G
Bought by
Maeva Michael G and Maeva Lauraa
Home Financials for this Owner
Home Financials are based on the most recent Mortgage that was taken out on this home.
Original Mortgage
$284,000
Interest Rate
5.55%
Mortgage Type
New Conventional
Purchase Details
Closed on
Sep 13, 2002
Sold by
Centex Homes
Bought by
Maeva Michael G and Maeva Laura A
Home Financials for this Owner
Home Financials are based on the most recent Mortgage that was taken out on this home.
Original Mortgage
$208,680
Interest Rate
6.37%
Create a Home Valuation Report for This Property
The Home Valuation Report is an in-depth analysis detailing your home's value as well as a comparison with similar homes in the area
Home Values in the Area
Average Home Value in this Area
Purchase History
| Date | Buyer | Sale Price | Title Company |
|---|---|---|---|
| Maeva Michael G | -- | Stewart Title Co | |
| Maeva Michael G | -- | -- | |
| Maeva Michael G | -- | Ticor Title Of Nevada Inc | |
| Maeva Michael G | $260,850 | Stewart Title Northern Nevad |
Source: Public Records
Mortgage History
| Date | Status | Borrower | Loan Amount |
|---|---|---|---|
| Open | Maeva Michael G | $221,000 | |
| Closed | Maeva Michael G | $284,000 | |
| Closed | Maeva Michael G | $208,680 |
Source: Public Records
Tax History
| Year | Tax Paid | Tax Assessment Tax Assessment Total Assessment is a certain percentage of the fair market value that is determined by local assessors to be the total taxable value of land and additions on the property. | Land | Improvement |
|---|---|---|---|---|
| 2026 | $2,726 | $154,179 | $45,850 | $108,329 |
| 2024 | $3,536 | $159,038 | $48,020 | $111,018 |
| 2023 | $2,570 | $152,357 | $47,320 | $105,037 |
| 2022 | $3,335 | $124,646 | $37,065 | $87,581 |
| 2021 | $3,239 | $114,850 | $27,720 | $87,130 |
| 2020 | $3,143 | $117,909 | $30,590 | $87,319 |
| 2019 | $3,053 | $112,373 | $28,000 | $84,373 |
| 2018 | $2,963 | $104,632 | $22,435 | $82,197 |
| 2017 | $2,876 | $104,344 | $22,050 | $82,294 |
| 2016 | $2,804 | $101,771 | $17,920 | $83,851 |
| 2015 | $2,799 | $102,449 | $18,760 | $83,689 |
| 2014 | $2,718 | $85,694 | $17,535 | $68,159 |
| 2013 | -- | $73,123 | $14,315 | $58,808 |
Source: Public Records
Map
Nearby Homes
- 2600 Anqua Ct
- 2600 Tuscan Way
- 1960 Vicenza Dr
- 2159 Meritage Dr
- 1760 Cosenza Dr
- 2060 Tivoli Ln Unit 2
- 2634 Michelangelo Ct
- 3375 Culpepper Dr
- 2152 Wabash Cir
- 1021 Ricco Dr
- 0 Martini Rd Unit 260001673
- 3307 Vincinato Dr
- 2688 Laguna Way
- 2419 Tecumseh Way
- 3142 Jarbidge Way
- 2381 Tecumseh Way Unit 18
- 931 Lionel Ct
- 1695 Atlantic Way
- 968 Railborne Dr
- 2625 Sunny Slope Dr
Your Personal Tour Guide
Ask me questions while you tour the home.