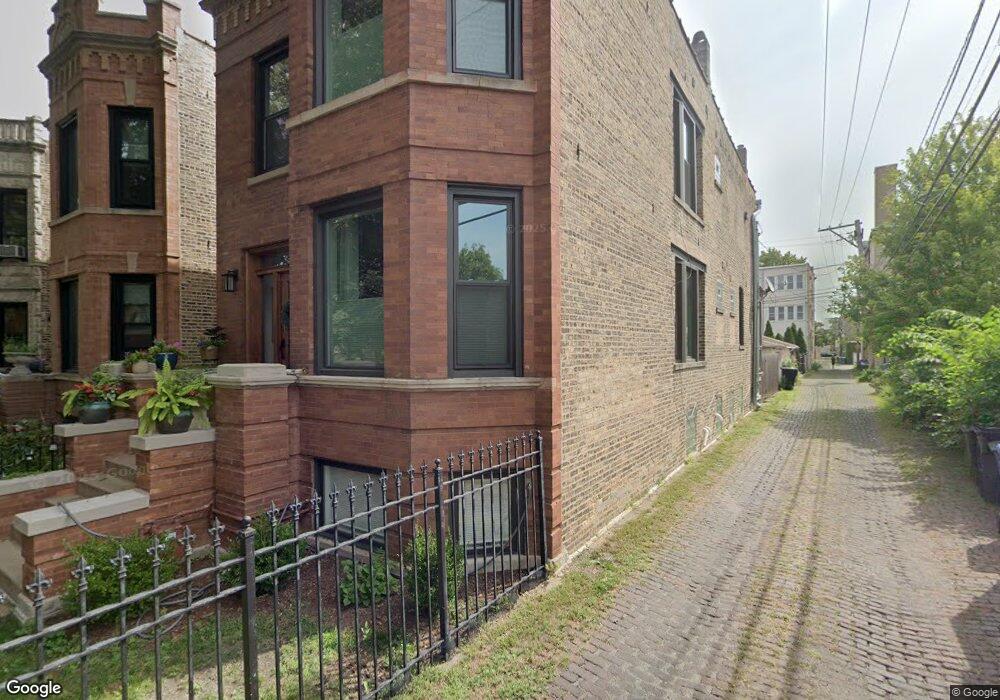
2615 N Francisco Ave Unit 1 Chicago, IL 60647
Logan Square NeighborhoodEstimated Value: $1,157,078 - $2,323,000
2
Beds
2
Baths
1,800
Sq Ft
$837/Sq Ft
Est. Value
About This Home
This home is located at 2615 N Francisco Ave Unit 1, Chicago, IL 60647 and is currently estimated at $1,506,270, approximately $836 per square foot. 2615 N Francisco Ave Unit 1 is a home located in Cook County with nearby schools including Brentano Math & Science Academy, Schurz High School, and Acero Charter - Carlos Fuentes Cmpus.
Ownership History
Date
Name
Owned For
Owner Type
Purchase Details
Closed on
Jan 13, 2025
Sold by
Dougherty Brian and Conway Margaret K
Bought by
Conway Dougherty Family Trust and Dougherty
Current Estimated Value
Purchase Details
Closed on
Jan 16, 2018
Sold by
Dmr Property Group Llc Francisco Series
Bought by
Conway Neafsey A and Conway Terrence J
Home Financials for this Owner
Home Financials are based on the most recent Mortgage that was taken out on this home.
Original Mortgage
$566,250
Interest Rate
3.87%
Mortgage Type
New Conventional
Purchase Details
Closed on
Feb 7, 2014
Sold by
Mallaney Michael and Hebel Donald
Bought by
Dmr Property Group Llc Francisco Series
Purchase Details
Closed on
Aug 11, 2000
Sold by
Pajor Kenneth B
Bought by
Pajor Kenneth B and Kenneth B Pajor Living Trust
Create a Home Valuation Report for This Property
The Home Valuation Report is an in-depth analysis detailing your home's value as well as a comparison with similar homes in the area
Home Values in the Area
Average Home Value in this Area
Purchase History
| Date | Buyer | Sale Price | Title Company |
|---|---|---|---|
| Conway Dougherty Family Trust | -- | None Listed On Document | |
| Conway Neafsey A | $755,000 | Chicago Title | |
| Dmr Property Group Llc Francisco Series | -- | None Available | |
| Pajor Kenneth B | -- | -- |
Source: Public Records
Mortgage History
| Date | Status | Borrower | Loan Amount |
|---|---|---|---|
| Previous Owner | Conway Neafsey A | $566,250 |
Source: Public Records
Tax History Compared to Growth
Tax History
| Year | Tax Paid | Tax Assessment Tax Assessment Total Assessment is a certain percentage of the fair market value that is determined by local assessors to be the total taxable value of land and additions on the property. | Land | Improvement |
|---|---|---|---|---|
| 2024 | $16,180 | $123,062 | $19,530 | $103,532 |
| 2023 | $16,494 | $79,728 | $15,750 | $63,978 |
| 2022 | $16,494 | $83,341 | $15,750 | $67,591 |
| 2021 | $12,612 | $65,845 | $15,750 | $50,095 |
| 2020 | $9,891 | $47,342 | $8,977 | $38,365 |
| 2019 | $10,726 | $53,194 | $8,977 | $44,217 |
| 2018 | $10,440 | $56,285 | $8,977 | $47,308 |
| 2017 | $7,593 | $38,649 | $7,875 | $30,774 |
| 2016 | $7,241 | $38,649 | $7,875 | $30,774 |
| 2015 | $6,602 | $38,649 | $7,875 | $30,774 |
| 2014 | $5,776 | $33,701 | $6,300 | $27,401 |
| 2013 | $5,651 | $33,701 | $6,300 | $27,401 |
Source: Public Records
Map
Nearby Homes
- 2918 W Logan Blvd Unit 2E
- 2810 W Logan Blvd Unit 3
- 2707 N Richmond St
- 2528 N Fairfield Ave
- 2518 N Willetts Ct Unit GS
- 2656 W Logan Blvd
- 2832 N Mozart St
- 2711 W Altgeld St Unit 2
- 2708 N Albany Ave
- 3319 W Fullerton Ave
- 2503 N Talman Ave
- 2828 N Talman Ave Unit D
- 2532 N Linden Place Unit 1
- 2417 N Washtenaw Ave
- 2917 N Richmond St
- 2554 W Logan Blvd Unit 402
- 2649 N Kedzie Ave Unit 4B
- 2612 W Diversey Ave Unit 101
- 2523 N Rockwell St
- 2927 N Sacramento Ave
- 2615 N Francisco Ave
- 2617 N Francisco Ave
- 2617 N Francisco Ave Unit 2
- 2617 N Francisco Ave
- 2621 N Francisco Ave
- 2623 N Francisco Ave Unit 2
- 2852 W Logan Blvd
- 2850 W Logan Blvd Unit 2
- 2850 W Logan Blvd Unit 1
- 2856 W Logan Blvd
- 2856 W Logan Blvd
- 2856 W Logan Blvd Unit 2
- 2627 N Francisco Ave Unit 2
- 2844 W Logan Blvd Unit 2
- 2629 N Francisco Ave
- 2629 N Francisco Ave Unit 2
- 2629 N Francisco Ave Unit 1
- 2618 N Mozart St Unit 4
- 2618 N Mozart St Unit GDN
- 2618 N Mozart St Unit G