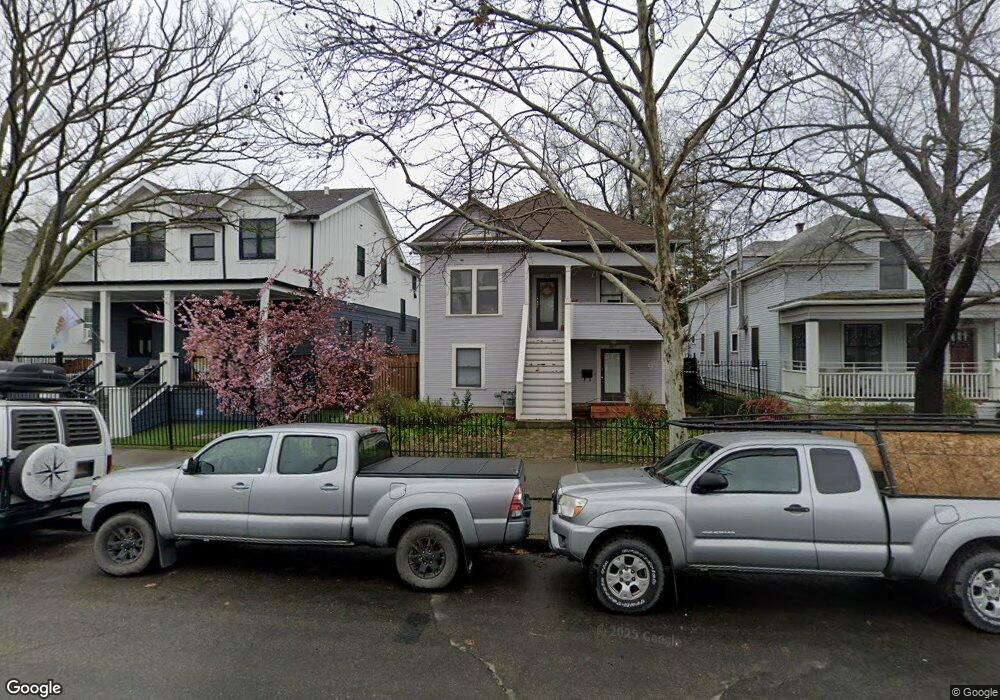
2615 S St Sacramento, CA 95816
Newton Booth NeighborhoodEstimated Value: $823,000 - $1,074,000
6
Beds
4
Baths
1,162
Sq Ft
$778/Sq Ft
Est. Value
About This Home
This home is located at 2615 S St, Sacramento, CA 95816 and is currently estimated at $903,924, approximately $777 per square foot. 2615 S St is a home located in Sacramento County with nearby schools including Theodore Judah Elementary, Miwok Middle School, and C. K. McClatchy High.
Ownership History
Date
Name
Owned For
Owner Type
Purchase Details
Closed on
Sep 30, 2022
Sold by
Wilcox-Jacques Family Trust
Bought by
Niswander Geoffrey and Misch Andrew
Current Estimated Value
Home Financials for this Owner
Home Financials are based on the most recent Mortgage that was taken out on this home.
Original Mortgage
$756,450
Outstanding Balance
$340,795
Interest Rate
5.55%
Mortgage Type
Seller Take Back
Estimated Equity
$563,129
Purchase Details
Closed on
Jul 21, 1999
Sold by
Jacques Wilcox Kenneth and Jacques Karen
Bought by
Wilcox Kenneth Hugh and Jacques Karen N
Create a Home Valuation Report for This Property
The Home Valuation Report is an in-depth analysis detailing your home's value as well as a comparison with similar homes in the area
Home Values in the Area
Average Home Value in this Area
Purchase History
| Date | Buyer | Sale Price | Title Company |
|---|---|---|---|
| Niswander Geoffrey | $775,000 | Fidelity National Title | |
| Wilcox Kenneth Hugh | -- | -- |
Source: Public Records
Mortgage History
| Date | Status | Borrower | Loan Amount |
|---|---|---|---|
| Open | Niswander Geoffrey | $756,450 |
Source: Public Records
Tax History Compared to Growth
Tax History
| Year | Tax Paid | Tax Assessment Tax Assessment Total Assessment is a certain percentage of the fair market value that is determined by local assessors to be the total taxable value of land and additions on the property. | Land | Improvement |
|---|---|---|---|---|
| 2025 | $9,359 | $806,310 | $286,110 | $520,200 |
| 2024 | $9,359 | $790,500 | $280,500 | $510,000 |
| 2023 | $9,139 | $775,000 | $275,000 | $500,000 |
| 2022 | $2,945 | $234,701 | $169,954 | $64,747 |
| 2021 | $2,810 | $230,100 | $166,622 | $63,478 |
| 2020 | $2,830 | $227,742 | $164,914 | $62,828 |
| 2019 | $2,771 | $223,278 | $161,681 | $61,597 |
| 2018 | $2,700 | $218,901 | $158,511 | $60,390 |
| 2017 | $2,663 | $214,609 | $155,403 | $59,206 |
| 2016 | $2,579 | $210,402 | $152,356 | $58,046 |
| 2015 | $2,542 | $207,243 | $150,068 | $57,175 |
| 2014 | $2,475 | $203,185 | $147,129 | $56,056 |
Source: Public Records
Map
Nearby Homes