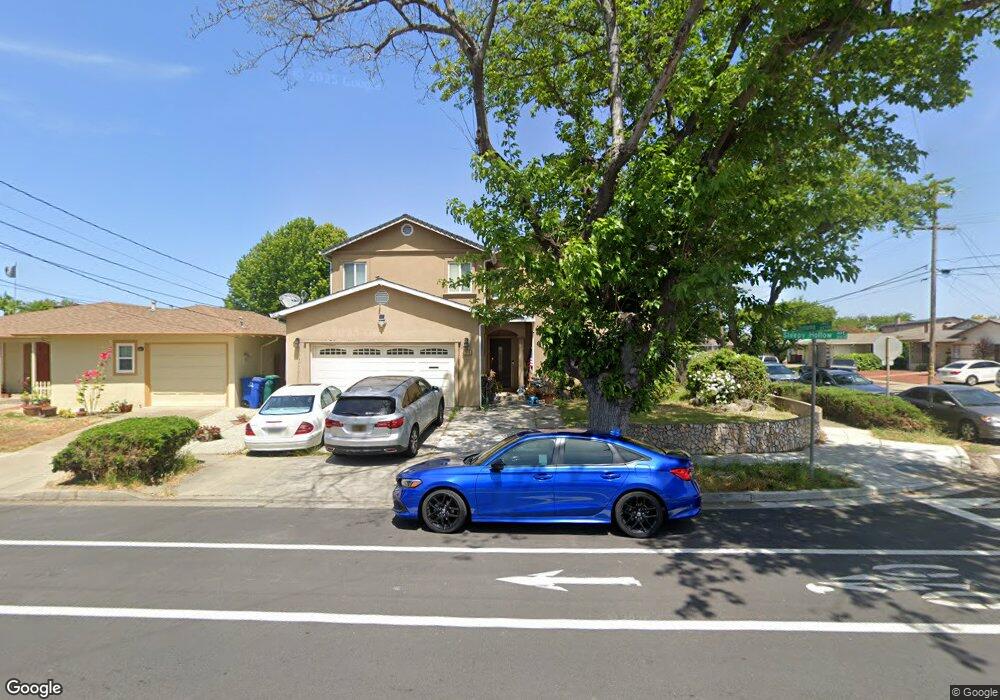
2615 Sleepy Hollow Ave Hayward, CA 94545
Glen Eden NeighborhoodEstimated Value: $1,117,000 - $1,463,133
7
Beds
5
Baths
3,060
Sq Ft
$414/Sq Ft
Est. Value
About This Home
This home is located at 2615 Sleepy Hollow Ave, Hayward, CA 94545 and is currently estimated at $1,267,283, approximately $414 per square foot. 2615 Sleepy Hollow Ave is a home located in Alameda County with nearby schools including Southgate Elementary School, Martin Luther King, Jr. Middle School, and Mt. Eden High School.
Ownership History
Date
Name
Owned For
Owner Type
Purchase Details
Closed on
Sep 2, 2021
Sold by
Celeste Danilo D and Celeste Christopher T
Bought by
Celeste Danilo D and Celeste Christopher T
Current Estimated Value
Home Financials for this Owner
Home Financials are based on the most recent Mortgage that was taken out on this home.
Original Mortgage
$718,000
Outstanding Balance
$652,351
Interest Rate
2.7%
Mortgage Type
New Conventional
Estimated Equity
$614,932
Purchase Details
Closed on
May 13, 2019
Sold by
Wendl Torsten
Bought by
Celeste Danilo D and Celeste Christopher T
Home Financials for this Owner
Home Financials are based on the most recent Mortgage that was taken out on this home.
Original Mortgage
$656,764
Interest Rate
4%
Mortgage Type
FHA
Purchase Details
Closed on
Sep 19, 2018
Sold by
Celeste Edgar D
Bought by
Wendl Torsten
Create a Home Valuation Report for This Property
The Home Valuation Report is an in-depth analysis detailing your home's value as well as a comparison with similar homes in the area
Home Values in the Area
Average Home Value in this Area
Purchase History
| Date | Buyer | Sale Price | Title Company |
|---|---|---|---|
| Celeste Danilo D | -- | First American Title Ins Co | |
| Celeste Danilo D | $669,000 | First American Title Comapny | |
| Wendl Torsten | $600,000 | First American Title Company |
Source: Public Records
Mortgage History
| Date | Status | Borrower | Loan Amount |
|---|---|---|---|
| Open | Celeste Danilo D | $718,000 | |
| Closed | Celeste Danilo D | $656,764 |
Source: Public Records
Tax History Compared to Growth
Tax History
| Year | Tax Paid | Tax Assessment Tax Assessment Total Assessment is a certain percentage of the fair market value that is determined by local assessors to be the total taxable value of land and additions on the property. | Land | Improvement |
|---|---|---|---|---|
| 2025 | $12,152 | $1,014,189 | $230,182 | $784,007 |
| 2024 | $12,152 | $994,307 | $225,670 | $768,637 |
| 2023 | $11,970 | $974,813 | $221,245 | $753,568 |
| 2022 | $11,735 | $955,701 | $216,907 | $738,794 |
| 2021 | $10,203 | $817,447 | $185,500 | $638,947 |
| 2020 | $10,588 | $816,000 | $183,600 | $632,400 |
| 2019 | $9,763 | $760,000 | $228,000 | $532,000 |
| 2018 | $8,185 | $670,161 | $96,111 | $574,050 |
| 2017 | $7,992 | $657,023 | $94,227 | $562,796 |
| 2016 | $7,889 | $644,141 | $92,379 | $551,762 |
| 2015 | $7,391 | $634,469 | $90,992 | $543,477 |
| 2014 | $7,012 | $622,044 | $89,210 | $532,834 |
Source: Public Records
Map
Nearby Homes
- 2675 Leeward St
- 2617 Naples St
- 26147 Stryker St
- 26142 Gettysburg Ave
- 2710 Ocala St
- 27342 Capri Ave
- 27553 Portsmouth Ave
- 26754 Contessa St
- 27568 Capri Ave
- 27459 Ponderosa Ct
- 2452 Oliver Dr
- 25930 Kay Ave Unit 201
- 25930 Kay Ave Unit 308
- 27801 Del Norte Ct
- 1280 Stanhope Ln Unit 343
- 27726 Del Norte Ct
- 1256 Stanhope Ln Unit 254
- 2421 Arf Ave
- 27949 Pueblo Serena Unit 78
- 25163 Copa Del Oro Dr Unit 202
- 2621 Sleepy Hollow Ave
- 26761 Bahama Ave
- 2627 Sleepy Hollow Ave
- 26772 Jamaica Ln
- 26745 Bahama Ave
- 26792 Bahama Ave
- 26776 Bahama Ave
- 26756 Jamaica Ln
- 2614 Sleepy Hollow Ave
- 2620 Sleepy Hollow Ave
- 26760 Bahama Ave
- 2626 Sleepy Hollow Ave
- 26740 Jamaica Ln
- 2594 Sleepy Hollow Ave
- 26744 Bahama Ave
- 2563 Sleepy Hollow Ave
- 26785 Campeche St
- 2632 Sleepy Hollow Ave
- 2639 Sleepy Hollow Ave
- 2576 Sleepy Hollow Ave