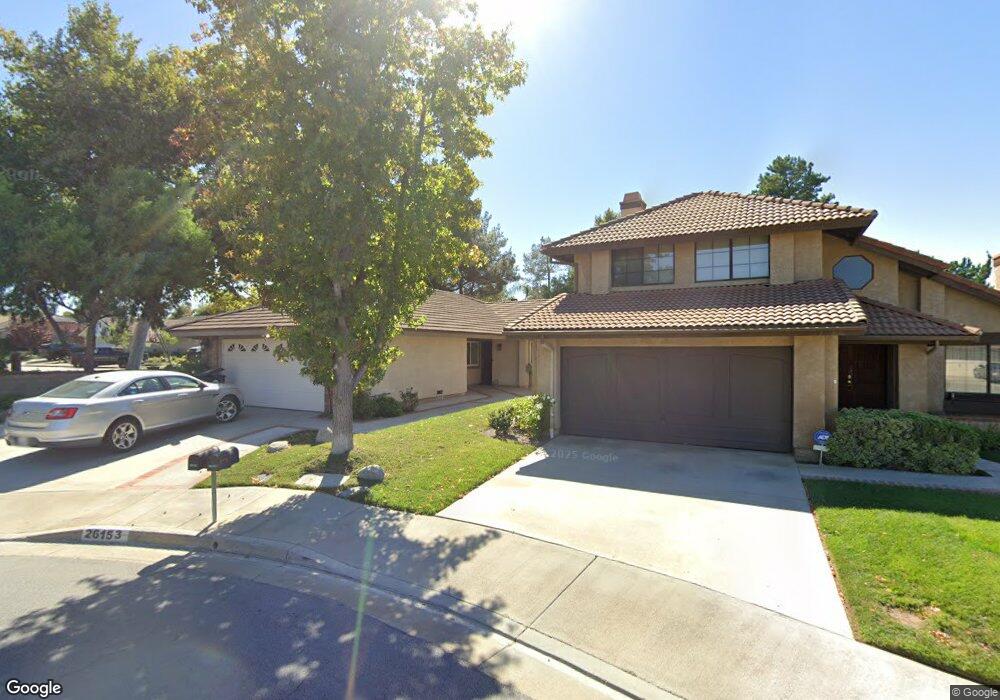
26153 Via Raza Valencia, CA 91355
Estimated Value: $803,047 - $860,000
3
Beds
2
Baths
1,614
Sq Ft
$511/Sq Ft
Est. Value
About This Home
This home is located at 26153 Via Raza, Valencia, CA 91355 and is currently estimated at $825,012, approximately $511 per square foot. 26153 Via Raza is a home located in Los Angeles County with nearby schools including Valencia Valley Elementary School, Placerita Junior High School, and William S. Hart High School.
Ownership History
Date
Name
Owned For
Owner Type
Purchase Details
Closed on
May 17, 2012
Sold by
Small Barbara J and Small Laurence H
Bought by
Small Laurence and Small Barbara
Current Estimated Value
Home Financials for this Owner
Home Financials are based on the most recent Mortgage that was taken out on this home.
Original Mortgage
$329,000
Outstanding Balance
$227,412
Interest Rate
3.85%
Mortgage Type
New Conventional
Estimated Equity
$597,600
Purchase Details
Closed on
Jul 15, 2004
Sold by
Small Laurence and Small Barbara J
Bought by
Small Laurence and Small Barbara
Purchase Details
Closed on
Jul 11, 2000
Sold by
Rey Hipolito Efren P and Rey Marceliza O
Bought by
Small Laurence and Sparrow Barbara J
Home Financials for this Owner
Home Financials are based on the most recent Mortgage that was taken out on this home.
Original Mortgage
$252,700
Interest Rate
8.15%
Create a Home Valuation Report for This Property
The Home Valuation Report is an in-depth analysis detailing your home's value as well as a comparison with similar homes in the area
Home Values in the Area
Average Home Value in this Area
Purchase History
| Date | Buyer | Sale Price | Title Company |
|---|---|---|---|
| Small Laurence | -- | Provident Title Company | |
| Small Barbara J | -- | Provident Title Company | |
| Small Laurence | -- | -- | |
| Small Laurence | $270,000 | Investors Title Company |
Source: Public Records
Mortgage History
| Date | Status | Borrower | Loan Amount |
|---|---|---|---|
| Open | Small Barbara J | $329,000 | |
| Closed | Small Laurence | $252,700 |
Source: Public Records
Tax History
| Year | Tax Paid | Tax Assessment Tax Assessment Total Assessment is a certain percentage of the fair market value that is determined by local assessors to be the total taxable value of land and additions on the property. | Land | Improvement |
|---|---|---|---|---|
| 2025 | $5,777 | $406,824 | $213,809 | $193,015 |
| 2024 | $5,777 | $398,848 | $209,617 | $189,231 |
| 2023 | $5,624 | $391,028 | $205,507 | $185,521 |
| 2022 | $5,521 | $383,362 | $201,478 | $181,884 |
| 2021 | $5,427 | $375,846 | $197,528 | $178,318 |
| 2019 | $5,245 | $364,700 | $191,670 | $173,030 |
| 2018 | $5,106 | $357,550 | $187,912 | $169,638 |
| 2016 | $4,837 | $343,667 | $180,616 | $163,051 |
| 2015 | $4,746 | $338,505 | $177,903 | $160,602 |
| 2014 | $4,669 | $331,876 | $174,419 | $157,457 |
Source: Public Records
Map
Nearby Homes
- 23735 Del Monte Dr Unit 170
- 23715 Del Monte Dr Unit 216
- 23921 Del Monte Dr Unit 34
- 23605 Del Monte Dr Unit 252
- 23633 Del Monte Dr Unit 272
- 23609 Del Monte Dr Unit 295
- 23629 Del Monte Dr Unit 283
- 23933 Del Monte Dr Unit 24
- 26013 Palomita Dr
- 26047 Palomita Dr
- 24043 Blacker House Ct
- 25820 El Gato Place
- 26129 Mcbean Pkwy Unit 43
- 23943 Arroyo Park Dr Unit 187
- 23971 Arroyo Park Dr Unit 79
- 26107 Mcbean Pkwy Unit 62
- 23643 Maricio Dr
- 24109 Del Monte Dr Unit 463
- 23926 Arroyo Park Dr Unit 123
- 25768 Covala Ct
- 26157 Via Raza
- 26161 Via Raza
- 26139 Bella Santa Dr
- 26152 Las Lanas Ct
- 26156 Las Lanas Ct
- 26138 Bella Santa Dr
- 26135 Bella Santa Dr
- 26160 Las Lanas Ct
- 26167 Via Raza
- 26134 Bella Santa Dr
- 26154 Via Raza
- 26158 Via Raza
- 26129 Bella Santa Dr
- 26166 Las Lanas Ct
- 26162 Via Raza
- 26132 Alejandro Dr
- 26173 Via Raza
- 26097 Tampico Dr
- 26128 Bella Santa Dr
- 26126 Alejandro Dr
Your Personal Tour Guide
Ask me questions while you tour the home.