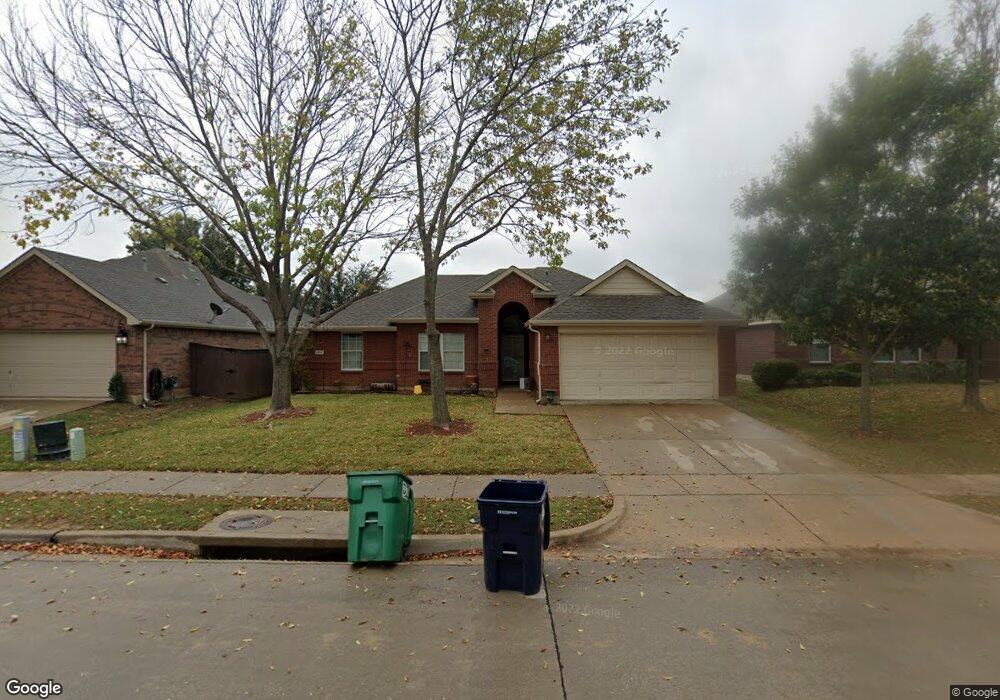
2616 Clubhouse Dr Denton, TX 76210
South Denton NeighborhoodEstimated Value: $323,710 - $364,000
3
Beds
2
Baths
1,518
Sq Ft
$227/Sq Ft
Est. Value
About This Home
This home is located at 2616 Clubhouse Dr, Denton, TX 76210 and is currently estimated at $344,678, approximately $227 per square foot. 2616 Clubhouse Dr is a home located in Denton County with nearby schools including Houston Elementary School, McMath Middle School, and Denton High School.
Ownership History
Date
Name
Owned For
Owner Type
Purchase Details
Closed on
May 10, 2024
Sold by
Kbr Financial Holdings Llc
Bought by
Moore Freeman Enterprises Llc
Current Estimated Value
Purchase Details
Closed on
Aug 31, 2015
Sold by
Freeman Moore R and Freeman Ryan
Bought by
Kbr Financial Holdings Llc
Purchase Details
Closed on
Jul 28, 2012
Sold by
Huling Donald R and Henry Tina J
Bought by
Freeman Moore R and Freeman Ryan
Home Financials for this Owner
Home Financials are based on the most recent Mortgage that was taken out on this home.
Original Mortgage
$109,225
Interest Rate
3.57%
Mortgage Type
Seller Take Back
Purchase Details
Closed on
Apr 30, 2004
Sold by
Bowen Family Homes Of Texas Inc
Bought by
Henry Tina J and Huling Donald Ray
Home Financials for this Owner
Home Financials are based on the most recent Mortgage that was taken out on this home.
Original Mortgage
$124,982
Interest Rate
5.81%
Mortgage Type
FHA
Create a Home Valuation Report for This Property
The Home Valuation Report is an in-depth analysis detailing your home's value as well as a comparison with similar homes in the area
Home Values in the Area
Average Home Value in this Area
Purchase History
| Date | Buyer | Sale Price | Title Company |
|---|---|---|---|
| Moore Freeman Enterprises Llc | -- | None Listed On Document | |
| Kbr Financial Holdings Llc | -- | None Available | |
| Freeman Moore R | -- | None Available | |
| Henry Tina J | -- | -- |
Source: Public Records
Mortgage History
| Date | Status | Borrower | Loan Amount |
|---|---|---|---|
| Previous Owner | Freeman Moore R | $109,225 | |
| Previous Owner | Henry Tina J | $124,982 |
Source: Public Records
Tax History Compared to Growth
Tax History
| Year | Tax Paid | Tax Assessment Tax Assessment Total Assessment is a certain percentage of the fair market value that is determined by local assessors to be the total taxable value of land and additions on the property. | Land | Improvement |
|---|---|---|---|---|
| 2025 | $5,791 | $307,000 | $85,250 | $221,750 |
| 2024 | $5,791 | $300,000 | $85,250 | $214,750 |
| 2023 | $5,270 | $276,000 | $85,250 | $190,750 |
| 2022 | $5,583 | $263,000 | $85,250 | $177,750 |
| 2021 | $4,780 | $215,000 | $63,163 | $151,837 |
| 2020 | $4,390 | $192,070 | $63,163 | $128,907 |
| 2019 | $4,534 | $190,000 | $63,163 | $126,837 |
| 2018 | $4,348 | $180,000 | $63,163 | $116,837 |
| 2017 | $3,991 | $161,482 | $37,575 | $123,907 |
| 2016 | $3,708 | $150,000 | $37,575 | $112,425 |
| 2015 | $3,317 | $138,146 | $37,575 | $100,571 |
| 2014 | $3,317 | $132,582 | $37,575 | $95,007 |
| 2013 | -- | $122,000 | $37,575 | $84,425 |
Source: Public Records
Map
Nearby Homes
- 2601 Pinto Dr
- 2617 Hereford Rd
- 2713 Clubhouse Dr
- 2721 Arabian Ave
- 2617 Hollow Ridge Dr
- 2600 Pioneer Dr
- 2508 Pioneer Dr
- 2817 Hereford Rd
- 2505 Pioneer Dr
- 2804 Hollow Ridge Dr
- 3428 Tuscan Hills Cir
- 3432 Sundown Blvd
- 3448 Tuscan Hills Cir
- 2713 Hilcroft Ave
- 2409 Loon Lake Rd
- 2616 Hilcroft Ave
- 2913 Montebello Dr
- 2617 Bissonet Dr
- 2917 Montebello Dr
- 3000 Bella Lago Dr
- 2620 Clubhouse Dr
- 2612 Clubhouse Dr
- 2617 Pinto Dr
- 2608 Clubhouse Dr
- 2613 Pinto Dr
- 2621 Pinto Dr
- 2609 Pinto Dr
- 2609 Clubhouse Dr
- 2700 Clubhouse Dr
- 2613 Clubhouse Dr
- 2604 Clubhouse Dr
- 2605 Clubhouse Dr
- 2605 Pinto Dr
- 2701 Pinto Dr
- 2600 Clubhouse Dr
- 2704 Clubhouse Dr
- 2701 Clubhouse Dr
- 2601 Clubhouse Dr
- 2705 Pinto Dr
- 2616 Pinto Dr