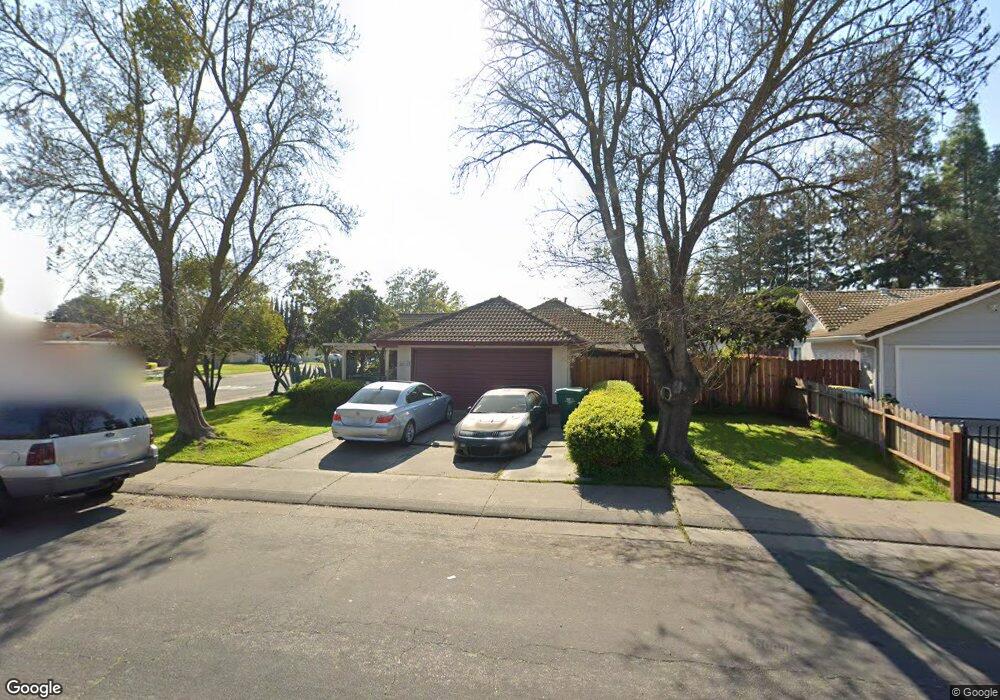
2616 Homewood Dr Stockton, CA 95210
Valley Oak NeighborhoodEstimated Value: $383,000 - $447,000
4
Beds
2
Baths
1,509
Sq Ft
$275/Sq Ft
Est. Value
About This Home
This home is located at 2616 Homewood Dr, Stockton, CA 95210 and is currently estimated at $414,615, approximately $274 per square foot. 2616 Homewood Dr is a home located in San Joaquin County with nearby schools including Rio Calaveras Elementary School, George W. Bush Elementary School, and Valentine Peyton Elementary School.
Ownership History
Date
Name
Owned For
Owner Type
Purchase Details
Closed on
Jul 6, 2007
Sold by
San Om and Pheng Thoeun
Bought by
Pheng Neang
Current Estimated Value
Home Financials for this Owner
Home Financials are based on the most recent Mortgage that was taken out on this home.
Original Mortgage
$204,750
Outstanding Balance
$135,261
Interest Rate
7.62%
Mortgage Type
Negative Amortization
Estimated Equity
$279,354
Purchase Details
Closed on
Sep 18, 2006
Sold by
San Om and Pheng Thoeun
Bought by
San Om and Pheng Thoeun
Purchase Details
Closed on
Apr 27, 2001
Sold by
San Om
Bought by
San Om and Pheng Thoeun
Purchase Details
Closed on
Oct 4, 1996
Sold by
Pheng Savarn and San Om
Bought by
Pheng Savarn and San Om
Purchase Details
Closed on
Feb 5, 1996
Sold by
Sim Sambath and Sam Somony
Bought by
Pheng Savarn and San Om
Home Financials for this Owner
Home Financials are based on the most recent Mortgage that was taken out on this home.
Original Mortgage
$94,836
Interest Rate
7.14%
Mortgage Type
FHA
Create a Home Valuation Report for This Property
The Home Valuation Report is an in-depth analysis detailing your home's value as well as a comparison with similar homes in the area
Home Values in the Area
Average Home Value in this Area
Purchase History
| Date | Buyer | Sale Price | Title Company |
|---|---|---|---|
| Pheng Neang | -- | Chicago Title Co | |
| Pheng Neang | -- | Chicago Title Co | |
| San Om | -- | None Available | |
| San Om | -- | -- | |
| Pheng Savarn | -- | -- | |
| Pheng Savarn | $95,000 | Old Republic Title Company |
Source: Public Records
Mortgage History
| Date | Status | Borrower | Loan Amount |
|---|---|---|---|
| Open | Pheng Neang | $204,750 | |
| Closed | Pheng Neang | $204,750 | |
| Previous Owner | Pheng Savarn | $94,836 |
Source: Public Records
Tax History Compared to Growth
Tax History
| Year | Tax Paid | Tax Assessment Tax Assessment Total Assessment is a certain percentage of the fair market value that is determined by local assessors to be the total taxable value of land and additions on the property. | Land | Improvement |
|---|---|---|---|---|
| 2025 | $3,435 | $279,663 | $92,767 | $186,896 |
| 2024 | $3,381 | $274,181 | $90,949 | $183,232 |
| 2023 | $3,306 | $268,806 | $89,166 | $179,640 |
| 2022 | $3,283 | $263,536 | $87,418 | $176,118 |
| 2021 | $3,155 | $258,369 | $85,704 | $172,665 |
| 2020 | $3,217 | $255,721 | $84,826 | $170,895 |
| 2019 | $3,204 | $250,708 | $83,163 | $167,545 |
| 2018 | $3,145 | $245,793 | $81,533 | $164,260 |
| 2017 | $2,979 | $240,975 | $79,935 | $161,040 |
| 2016 | $3,034 | $236,251 | $78,368 | $157,883 |
| 2014 | $2,158 | $170,000 | $51,000 | $119,000 |
Source: Public Records
Map
Nearby Homes
- 7028 Tristan Cir
- 7127 Tristan Cir Unit 10
- 7112 Tristan Cir
- 7238 Sharkon Ln
- 1926 Shameran St
- 5813 Fred Russo Dr
- 1864 Caleb Cir
- 5718 Krissi Ct
- 6130 Fred Russo Dr
- 2815 Keyser Dr
- 8007 Lorraine Ave
- 8110 Rouen Ct
- 8107 8107 Grenoble Way
- 5431 Strawberry Way
- 2810 Auto Center Cir
- 5831 Caribbean Cir
- 1657 Knickerbocker Dr
- 5816 Caribbean Cir
- 8153 Moulin Ct
- 6706 Tam o Shanter Dr Unit 34
- 2608 Homewood Dr
- 6921 Ector Way
- 2510 Homewood Dr
- 6829 Ector Way
- 6936 Ector Way
- 6924 Ector Way
- 6818 Percival Way
- 2619 Homewood Dr
- 2611 Homewood Dr
- 6832 Ector Way
- 2502 Homewood Dr
- 2705 Homewood Dr
- 6922 Percival Way
- 6817 Ector Way
- 7004 Percival Way
- 6726 Percival Way
- 6820 Ector Way
- 2713 Homewood Dr
- 6935 Village Green Dr
- 6937 Village Green Dr