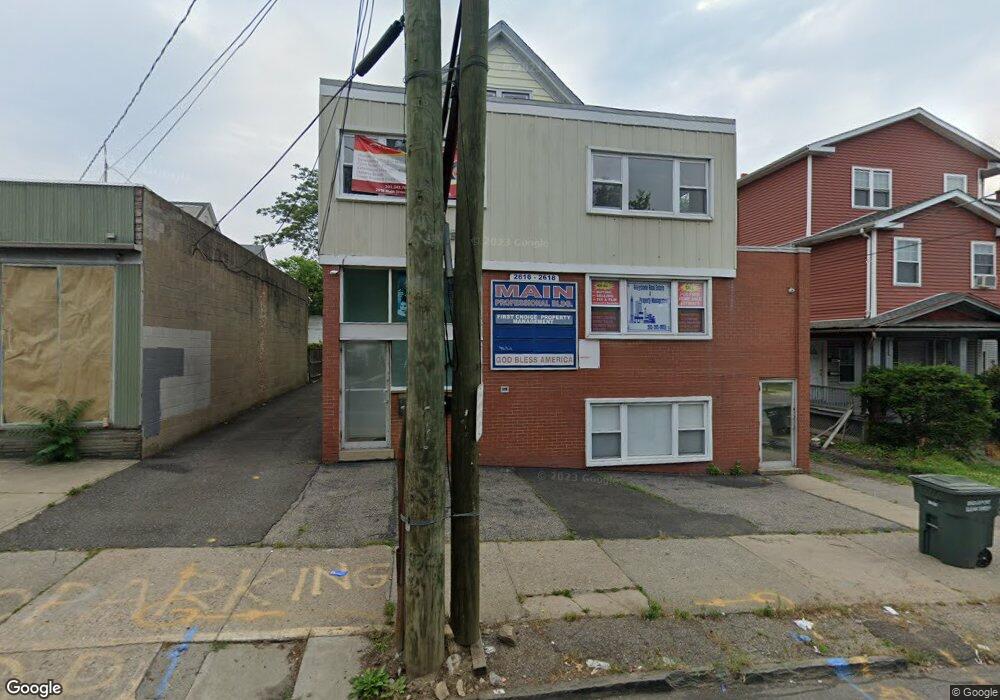
2616 Main St Bridgeport, CT 06606
Brooklawn-Saint Vincent NeighborhoodEstimated Value: $598,909
3
Beds
3
Baths
4,185
Sq Ft
$143/Sq Ft
Est. Value
About This Home
This home is located at 2616 Main St, Bridgeport, CT 06606 and is currently estimated at $598,909, approximately $143 per square foot. 2616 Main St is a home located in Fairfield County with nearby schools including Read School, Central High School, and Catholic Academy of Bridgeport-St. Raphael Academy.
Ownership History
Date
Name
Owned For
Owner Type
Purchase Details
Closed on
Oct 26, 2021
Sold by
1St Choice Prop Mgmt 104
Bought by
Mgjy Properties Llc
Current Estimated Value
Home Financials for this Owner
Home Financials are based on the most recent Mortgage that was taken out on this home.
Original Mortgage
$386,500
Outstanding Balance
$353,216
Interest Rate
2.8%
Mortgage Type
Purchase Money Mortgage
Estimated Equity
$245,693
Purchase Details
Closed on
Oct 5, 2021
Sold by
Higgins Linden
Bought by
1St Choice Prop Mgmt
Home Financials for this Owner
Home Financials are based on the most recent Mortgage that was taken out on this home.
Original Mortgage
$386,500
Outstanding Balance
$353,216
Interest Rate
2.8%
Mortgage Type
Purchase Money Mortgage
Estimated Equity
$245,693
Purchase Details
Closed on
Sep 22, 2014
Sold by
Bayview Loan Servicing
Bought by
Higgins Linden
Purchase Details
Closed on
Nov 6, 2013
Sold by
Seaside Partners Inc
Bought by
Bayview Loan Servicing
Purchase Details
Closed on
Jul 25, 2005
Sold by
Vincenzi Adriana
Bought by
Seaside Partners
Create a Home Valuation Report for This Property
The Home Valuation Report is an in-depth analysis detailing your home's value as well as a comparison with similar homes in the area
Home Values in the Area
Average Home Value in this Area
Purchase History
| Date | Buyer | Sale Price | Title Company |
|---|---|---|---|
| Mgjy Properties Llc | $435,000 | None Available | |
| Mgjy Properties Llc | $435,000 | None Available | |
| 1St Choice Prop Mgmt | -- | None Available | |
| 1St Choice Prop Mgmt | -- | None Available | |
| Higgins Linden | -- | -- | |
| Higgins Linden | -- | -- | |
| Bayview Loan Servicing | -- | -- | |
| Bayview Loan Servicing | -- | -- | |
| Seaside Partners | $430,000 | -- | |
| Seaside Partners | $430,000 | -- |
Source: Public Records
Mortgage History
| Date | Status | Borrower | Loan Amount |
|---|---|---|---|
| Open | Mgjy Properties Llc | $386,500 | |
| Closed | Mgjy Properties Llc | $386,500 | |
| Previous Owner | Seaside Partners | $16,000 | |
| Previous Owner | Seaside Partners | $50,000 |
Source: Public Records
Tax History Compared to Growth
Tax History
| Year | Tax Paid | Tax Assessment Tax Assessment Total Assessment is a certain percentage of the fair market value that is determined by local assessors to be the total taxable value of land and additions on the property. | Land | Improvement |
|---|---|---|---|---|
| 2025 | $10,327 | $237,670 | $89,420 | $148,250 |
| 2024 | $10,327 | $237,670 | $89,420 | $148,250 |
| 2023 | $10,327 | $237,670 | $89,420 | $148,250 |
| 2022 | $10,327 | $237,670 | $89,420 | $148,250 |
| 2021 | $10,327 | $237,670 | $89,420 | $148,250 |
| 2020 | $11,238 | $208,150 | $73,240 | $134,910 |
| 2019 | $11,238 | $208,150 | $73,240 | $134,910 |
| 2018 | $11,317 | $208,150 | $73,240 | $134,910 |
| 2017 | $11,317 | $208,150 | $73,240 | $134,910 |
| 2016 | $11,317 | $208,150 | $73,240 | $134,910 |
| 2015 | $9,619 | $227,940 | $87,890 | $140,050 |
| 2014 | $9,619 | $227,940 | $87,890 | $140,050 |
Source: Public Records
Map
Nearby Homes
- 330 French St
- 2395 Main St Unit 2397
- 724 Capitol Ave Unit 726
- 508 Hawley Ave
- 119 Madison Terrace
- 936 Lindley St
- 390 Charles St Unit 106
- 390 Charles St Unit 216
- 980 Lindley St Unit 401
- 106 Manhattan Ave Unit 108
- 123 Harlem Ave
- 76 Porter St
- 252 Harlem Ave Unit B6
- 926 Hart St
- 916 Hart St
- 31 Taft Ave
- 137 Holroyd St
- 110 Quince St
- 105 Tremont Ave Unit E
- 125 Sampson St
- 2606 Main St Unit 2608
- 2624 Main St Unit 2624
- 432 French St
- 169 Salem St
- 422 French St
- 157-159 Salem St Unit 159
- 157-159 Salem St
- 157 Salem St Unit 159
- 215 Salem St
- 215 Salem St Unit A
- 215C Salem St Unit 3
- 215A Salem St
- 215 Salem St Unit B
- 215C Salem St
- 215 Salem St Unit C
- 414 French St Unit 2
- 414 French St
- 2591 Main St
- 412 French St
- 2583 Main St