Estimated Value: $176,800 - $239,000
3
Beds
1
Bath
1,144
Sq Ft
$170/Sq Ft
Est. Value
About This Home
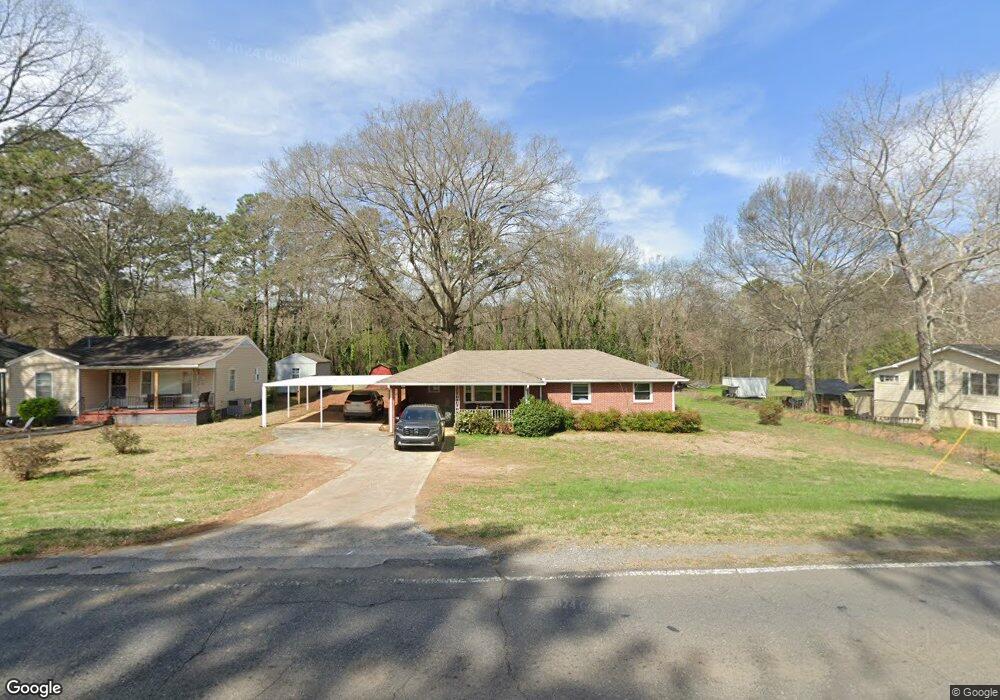
This home is located at 2616 Maple Dr SE, Rome, GA 30161 and is currently estimated at $194,950, approximately $170 per square foot. 2616 Maple Dr SE is a home located in Floyd County with nearby schools including Pepperell Middle School, Pepperell High School, and Montessori School of Rome.
Ownership History
Date
Name
Owned For
Owner Type
Purchase Details
Closed on
Jul 16, 2021
Sold by
Drummond Donald Lee
Bought by
Katz Shannon Elizabeth and Katz Daniel Alexander
Current Estimated Value
Home Financials for this Owner
Home Financials are based on the most recent Mortgage that was taken out on this home.
Original Mortgage
$96,000
Outstanding Balance
$87,145
Interest Rate
2.93%
Mortgage Type
New Conventional
Estimated Equity
$107,805
Purchase Details
Closed on
Jan 3, 2017
Sold by
Michael Phillip
Bought by
Drummond Donald Lee
Purchase Details
Closed on
Sep 1, 2010
Sold by
Hanson Linda Jo Gaston
Bought by
Gaston Phillip Michael
Purchase Details
Closed on
Jun 17, 1987
Sold by
Gaston Joseph L Gaston Joseph L Gasto
Bought by
Gaston Erma G
Purchase Details
Closed on
Apr 30, 1965
Sold by
Morris Harry W Morris Harry W Morris
Bought by
Gaston Joseph L Gaston Joseph L Gaston J
Purchase Details
Closed on
Nov 1, 1955
Bought by
Morris Harry W Morris Harry W Morri
Create a Home Valuation Report for This Property
The Home Valuation Report is an in-depth analysis detailing your home's value as well as a comparison with similar homes in the area
Home Values in the Area
Average Home Value in this Area
Purchase History
| Date | Buyer | Sale Price | Title Company |
|---|---|---|---|
| Katz Shannon Elizabeth | $120,000 | -- | |
| Drummond Donald Lee | $59,000 | -- | |
| Gaston Phillip Michael | -- | -- | |
| Gaston Phillip Michael | -- | -- | |
| Hanson Linda Jo Gaston | -- | -- | |
| Gaston Erma G | -- | -- | |
| Gaston Joseph L Gaston Joseph L Gaston J | $13,500 | -- | |
| Morris Harry W Morris Harry W Morri | -- | -- |
Source: Public Records
Mortgage History
| Date | Status | Borrower | Loan Amount |
|---|---|---|---|
| Open | Katz Shannon Elizabeth | $96,000 |
Source: Public Records
Tax History Compared to Growth
Tax History
| Year | Tax Paid | Tax Assessment Tax Assessment Total Assessment is a certain percentage of the fair market value that is determined by local assessors to be the total taxable value of land and additions on the property. | Land | Improvement |
|---|---|---|---|---|
| 2024 | $1,994 | $62,227 | $10,800 | $51,427 |
| 2023 | $1,843 | $58,986 | $9,600 | $49,386 |
| 2022 | $1,488 | $49,149 | $8,000 | $41,149 |
| 2021 | $1,422 | $45,066 | $8,000 | $37,066 |
| 2020 | $1,307 | $40,989 | $6,000 | $34,989 |
| 2019 | $1,225 | $38,947 | $6,000 | $32,947 |
| 2018 | $763 | $36,906 | $6,000 | $30,906 |
| 2017 | $943 | $32,706 | $6,000 | $26,706 |
| 2016 | $931 | $31,920 | $6,000 | $25,920 |
| 2015 | -- | $31,920 | $6,000 | $25,920 |
| 2014 | -- | $31,920 | $6,000 | $25,920 |
Source: Public Records
Map
Nearby Homes
- 2523 Maple Rd SE
- 2710 Maple Rd SE
- 212 Alfred Ave SE
- 211 Alfred Ave SE
- 2508 Maple Rd SE
- 2501 Maple Rd SE
- 2812 Maple Rd SE
- 107 E Linden St SE
- 36 Saddle Mountain Rd SE
- 0 Martha Berry Hwy Unit 7525627
- 0 Martha Berry Hwy Unit 7614774
- 0 Martha Berry Hwy Unit 10563404
- 327 Flora Ave SE
- 333 Alfred Ave SE
- 409 Flora Ave SE
- 2108 Maple Ave SW
- 3 Belmont Ct SE
- 15 Saddlebrook Dr SE
- 7 Willingham St SW
- 3010 Maple Rd SE
- 2616 Maple Rd SE
- 2614 Maple Rd SE
- 2620 Maple Rd SE
- 2608 Maple Rd SE Unit 4
- 2608 Maple Rd SE
- 2622 Maple Rd SE
- 2617 Maple Rd SE
- 2615 Maple Rd SE
- 2613 Maple Rd SE
- 2619 Maple Rd SE
- 2606 Maple Rd SE
- 2607 Maple Rd SE
- 2702 Maple Rd SE
- 2604 Maple Rd SE
- 2605 Maple Rd SE
- 2605 Maple Rd SE Unit 4, PT 3
- 2701 Maple Rd SE
- 210 Flora Ave SE
- 2704 Maple Rd SE
- 208 Flora Ave SE