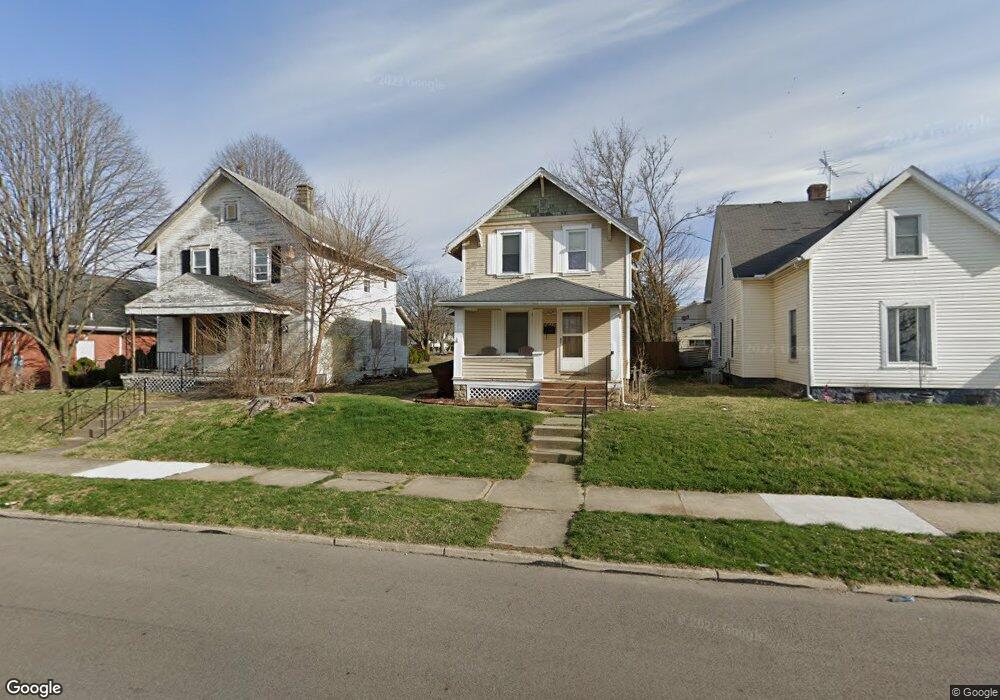
2616 Maplewood Ave Springfield, OH 45505
Estimated Value: $121,000 - $153,000
2
Beds
1
Bath
992
Sq Ft
$136/Sq Ft
Est. Value
About This Home
This home is located at 2616 Maplewood Ave, Springfield, OH 45505 and is currently estimated at $134,522, approximately $135 per square foot. 2616 Maplewood Ave is a home located in Clark County with nearby schools including Mann Elementary School, Schaefer Middle School, and Springfield High School.
Ownership History
Date
Name
Owned For
Owner Type
Purchase Details
Closed on
Apr 10, 2015
Sold by
Seisher Lee R
Bought by
Oliver Tre M
Current Estimated Value
Home Financials for this Owner
Home Financials are based on the most recent Mortgage that was taken out on this home.
Original Mortgage
$48,995
Outstanding Balance
$37,758
Interest Rate
3.77%
Mortgage Type
FHA
Estimated Equity
$96,764
Purchase Details
Closed on
Dec 18, 1998
Sold by
Paugh William S and Paugh Carolyn S
Bought by
Swisher Lee R
Home Financials for this Owner
Home Financials are based on the most recent Mortgage that was taken out on this home.
Original Mortgage
$50,000
Interest Rate
6.96%
Mortgage Type
Purchase Money Mortgage
Purchase Details
Closed on
Sep 8, 1997
Sold by
Turner Alma G
Bought by
Paugh William S and Paugh Carolyn
Create a Home Valuation Report for This Property
The Home Valuation Report is an in-depth analysis detailing your home's value as well as a comparison with similar homes in the area
Home Values in the Area
Average Home Value in this Area
Purchase History
| Date | Buyer | Sale Price | Title Company |
|---|---|---|---|
| Oliver Tre M | $49,900 | Team Title & Closing Svcs | |
| Swisher Lee R | $50,000 | -- | |
| Paugh William S | $32,000 | -- |
Source: Public Records
Mortgage History
| Date | Status | Borrower | Loan Amount |
|---|---|---|---|
| Open | Oliver Tre M | $48,995 | |
| Previous Owner | Swisher Lee R | $50,000 |
Source: Public Records
Tax History Compared to Growth
Tax History
| Year | Tax Paid | Tax Assessment Tax Assessment Total Assessment is a certain percentage of the fair market value that is determined by local assessors to be the total taxable value of land and additions on the property. | Land | Improvement |
|---|---|---|---|---|
| 2024 | $1,488 | $30,860 | $4,030 | $26,830 |
| 2023 | $1,488 | $30,860 | $4,030 | $26,830 |
| 2022 | $1,525 | $30,860 | $4,030 | $26,830 |
| 2021 | $1,182 | $22,100 | $3,150 | $18,950 |
| 2020 | $1,184 | $22,100 | $3,150 | $18,950 |
| 2019 | $1,187 | $22,100 | $3,150 | $18,950 |
| 2018 | $1,165 | $20,830 | $2,620 | $18,210 |
| 2017 | $1,164 | $20,696 | $2,622 | $18,074 |
| 2016 | $1,166 | $20,696 | $2,622 | $18,074 |
| 2015 | $1,244 | $20,696 | $2,622 | $18,074 |
| 2014 | $1,239 | $20,696 | $2,622 | $18,074 |
| 2013 | $1,225 | $20,696 | $2,622 | $18,074 |
Source: Public Records
Map
Nearby Homes
- 112 N Burnett Rd
- 2702 Maplewood Ave
- 127 Bellevue Ave
- 325 N Burnett Rd
- 196 Belleaire Ave
- 402 Roseland Ave E
- 319 Bellevue Ave
- 120 S Fostoria Ave
- 2226 E High St
- 320 N Clairmont Ave
- 415 Belleaire Ave
- 184 Willis Ave
- 327 Buxton Ave
- 2201 E High St
- 360 Buxton Ave
- 2256 Hillside Ave
- 2422 Lexington Ave
- 2201 Elmwood Ave
- 2434 Irwin Ave
- 26 N Belmont Ave
- 2626 Maplewood Ave
- 2614 Maplewood Ave
- 2630 Maplewood Ave
- 2617 Maplewood Ave
- 2609 Maplewood Ave
- 2625 Maplewood Ave
- 2633 Maplewood Ave
- 2639 Maplewood Ave
- 2648 Maplewood Ave
- 2645 Maplewood Ave
- 2654 Maplewood Ave
- 0 S Burnett Rd
- 37 S Burnett Rd
- 2649 Maplewood Ave
- 33 S Burnett Rd
- 2656 Maplewood Ave
- 2655 Maplewood Ave
- 2628 E Main St
- 2657 Maplewood Ave
- 2636 E Main St