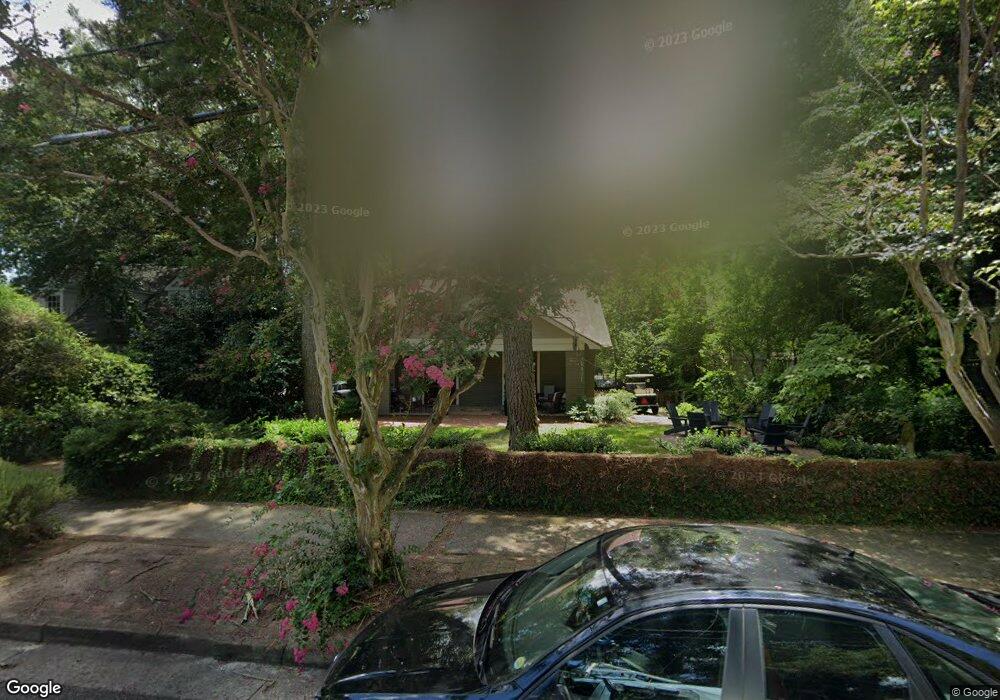
2616 Mcdowell St Augusta, GA 30904
Summerville NeighborhoodEstimated Value: $274,000 - $363,000
2
Beds
1
Bath
1,504
Sq Ft
$215/Sq Ft
Est. Value
About This Home
This home is located at 2616 Mcdowell St, Augusta, GA 30904 and is currently estimated at $323,737, approximately $215 per square foot. 2616 Mcdowell St is a home located in Richmond County with nearby schools including R.B. Hunt Elementary School, Monte Sano Elementary School, and Langford Middle School.
Ownership History
Date
Name
Owned For
Owner Type
Purchase Details
Closed on
Jun 21, 1995
Sold by
Hancock Frederick L Tr By Atty Hancock
Bought by
Brown Michael A Brown Laura L
Current Estimated Value
Purchase Details
Closed on
Jun 2, 1995
Sold by
Hancock Frederick L Tr By Atty Hancock I
Bought by
Brown Michael A Brown Laura L
Purchase Details
Closed on
Jun 1, 1995
Sold by
Hancock Frederick L
Bought by
Brown Michael A
Purchase Details
Closed on
Dec 15, 1994
Sold by
Hancock Joanne Craf
Bought by
Hancock Frederick L
Purchase Details
Closed on
May 22, 1991
Sold by
Crafton Philomena F By Exrx
Bought by
Hancock Joanne Crafton
Purchase Details
Closed on
May 21, 1991
Sold by
Crafton Philomena F
Bought by
Hancock Joanne Craf
Create a Home Valuation Report for This Property
The Home Valuation Report is an in-depth analysis detailing your home's value as well as a comparison with similar homes in the area
Home Values in the Area
Average Home Value in this Area
Purchase History
| Date | Buyer | Sale Price | Title Company |
|---|---|---|---|
| Brown Michael A Brown Laura L | -- | -- | |
| Brown Michael A Brown Laura L | -- | -- | |
| Brown Michael A | $83,900 | -- | |
| Hancock Frederick L | $67,900 | -- | |
| Hancock Joanne Crafton | -- | -- | |
| Hancock Joanne Craf | -- | -- |
Source: Public Records
Tax History Compared to Growth
Tax History
| Year | Tax Paid | Tax Assessment Tax Assessment Total Assessment is a certain percentage of the fair market value that is determined by local assessors to be the total taxable value of land and additions on the property. | Land | Improvement |
|---|---|---|---|---|
| 2025 | $4,276 | $134,572 | $40,296 | $94,276 |
| 2024 | $4,276 | $128,516 | $40,296 | $88,220 |
| 2023 | $4,028 | $113,084 | $40,296 | $72,788 |
| 2022 | $3,279 | $97,064 | $40,296 | $56,768 |
| 2021 | $3,183 | $85,530 | $40,296 | $45,234 |
| 2020 | $2,592 | $69,064 | $28,030 | $41,034 |
| 2019 | $2,756 | $69,064 | $28,030 | $41,034 |
| 2018 | $2,778 | $69,064 | $28,030 | $41,034 |
| 2017 | $2,764 | $69,064 | $28,030 | $41,034 |
| 2016 | $2,765 | $69,063 | $28,030 | $41,034 |
| 2015 | $2,783 | $69,063 | $28,030 | $41,034 |
| 2014 | $2,786 | $69,063 | $28,030 | $41,034 |
Source: Public Records
Map
Nearby Homes
- 2619 Raymond Ave
- 2632 Raymond Ave
- 1425 Glenn Ave
- 1526 Craig St
- 2603 Wrightsboro Rd
- 2812 Helen St
- 2442 Mcdowell St
- 1117 Highland Ave
- 1141 Arsenal Ave
- 1744 Pennsylvania Ave
- 2607 Mckibben St
- 1811 Pennsylvania Ave
- 2602 Walton Way
- 2349 Wrightsboro Rd
- 2904 Lombardy Ct
- 1833 Pennsylvania Ave
- 1514 Heath St
- 1916 Ohio Ave
- 815 Johns Rd
- 1516 Johns Rd
- 2612 Mcdowell St
- 1406 Glenn Ave
- 1404 Glenn Ave
- 1408 Glenn Ave
- 1402 Glenn Ave
- 2615 Mcdowell St
- 2614 Mcleod St
- 1337 Monte Sano Ave
- 1426 Glenn Ave
- 1428 Glenn Ave
- 1336 Glenn Ave
- 2609 Central Ave
- 2710 Mc Leod St
- 1429 Monte Sano Ave
- 1335 Monte Sano Ave
- 1401 Glenn Ave
- 1403 Glenn Ave
- 1430 Glenn Ave
- 1334 Glenn Ave
- 1405 Glenn Ave