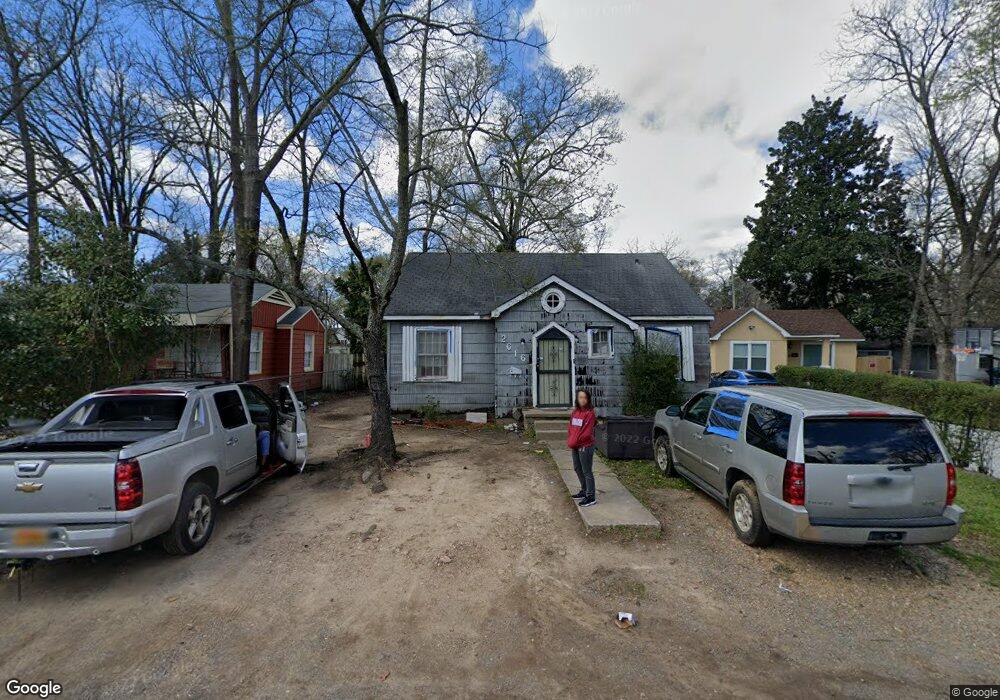
2616 S Van Buren St Little Rock, AR 72204
Oak Forest NeighborhoodEstimated Value: $70,991 - $124,000
--
Bed
1
Bath
876
Sq Ft
$103/Sq Ft
Est. Value
About This Home
This home is located at 2616 S Van Buren St, Little Rock, AR 72204 and is currently estimated at $89,998, approximately $102 per square foot. 2616 S Van Buren St is a home located in Pulaski County with nearby schools including Stephens Elementary School, J.A. Fair K8 Preparatory School, and Henderson Middle School.
Ownership History
Date
Name
Owned For
Owner Type
Purchase Details
Closed on
Jul 10, 2025
Sold by
Commissioner Of State Lands
Bought by
Hill Joe and Hill Lisa
Current Estimated Value
Purchase Details
Closed on
Jul 6, 2012
Sold by
Dele Llc
Bought by
Hill Joe and Hill Lisa
Purchase Details
Closed on
Nov 19, 2010
Sold by
Whitaker Jim and Whitaker Clara
Bought by
Encore Homes Inc
Purchase Details
Closed on
Feb 18, 1999
Sold by
Advance Realty Corp
Bought by
Edwards Dell L and Edwards Laquita R
Home Financials for this Owner
Home Financials are based on the most recent Mortgage that was taken out on this home.
Original Mortgage
$12,500
Interest Rate
6.5%
Mortgage Type
Seller Take Back
Purchase Details
Closed on
Dec 22, 1998
Sold by
Sipes Stephen C
Bought by
Advance Realty Corp
Home Financials for this Owner
Home Financials are based on the most recent Mortgage that was taken out on this home.
Original Mortgage
$12,500
Interest Rate
6.5%
Mortgage Type
Seller Take Back
Create a Home Valuation Report for This Property
The Home Valuation Report is an in-depth analysis detailing your home's value as well as a comparison with similar homes in the area
Home Values in the Area
Average Home Value in this Area
Purchase History
| Date | Buyer | Sale Price | Title Company |
|---|---|---|---|
| Hill Joe | $1,434 | None Listed On Document | |
| Hill Joe | $12,000 | West Little Rock Title Co | |
| Encore Homes Inc | -- | None Available | |
| Edwards Dell L | $13,000 | Lenders Title Company | |
| Advance Realty Corp | $10,000 | -- |
Source: Public Records
Mortgage History
| Date | Status | Borrower | Loan Amount |
|---|---|---|---|
| Previous Owner | Edwards Dell L | $12,500 |
Source: Public Records
Tax History Compared to Growth
Tax History
| Year | Tax Paid | Tax Assessment Tax Assessment Total Assessment is a certain percentage of the fair market value that is determined by local assessors to be the total taxable value of land and additions on the property. | Land | Improvement |
|---|---|---|---|---|
| 2025 | $305 | $5,431 | $700 | $4,731 |
| 2024 | $262 | $5,431 | $700 | $4,731 |
| 2023 | $262 | $5,431 | $700 | $4,731 |
| 2022 | $240 | $5,431 | $700 | $4,731 |
| 2021 | $220 | $3,120 | $600 | $2,520 |
| 2020 | $218 | $3,120 | $600 | $2,520 |
| 2019 | $218 | $3,120 | $600 | $2,520 |
| 2018 | $218 | $3,120 | $600 | $2,520 |
| 2017 | $218 | $3,120 | $600 | $2,520 |
| 2016 | $361 | $5,160 | $1,400 | $3,760 |
| 2015 | $362 | $5,160 | $1,400 | $3,760 |
| 2014 | $362 | $5,160 | $1,400 | $3,760 |
Source: Public Records
Map
Nearby Homes
- 2703 S Harrison St
- 2600 S Van Buren St
- 2712 Boulevard Ave
- 4903 W 28th St
- 5212 W 31st St
- 5216 W 31st St
- 4820 W 29th St
- 2303 S Tyler St
- 4816 W 30th St
- 5001 W 31st St
- 2703 Madison St
- 4724 W 26th St
- 5209 W 22nd St
- 4624 W 29th St
- 4614 W 30th St
- 4510 W 29th St
- 4501 W 28th St
- 4503 W 29th St
- 000 S Harrison St
- 4423 W 26th St
- 2612 S Van Buren St
- 2700 S Van Buren St
- 2608 S Van Buren St
- 2704 S Van Buren St
- 2604 S Van Buren St
- 2623 S Harrison St
- 2617 S Van Buren St
- 2617 S Harrison St
- 2613 S Van Buren St
- 5204 W 28th St
- 5200 W 28th St
- 2701 S Van Buren St
- 2705 S Harrison St
- 2609 S Van Buren St
- 2719 S Harrison St
- 2603 S Harrison St
- 2709 S Van Buren St
- 2723 S Harrison St
- S Van Buren St
- 2601 S Harrison St