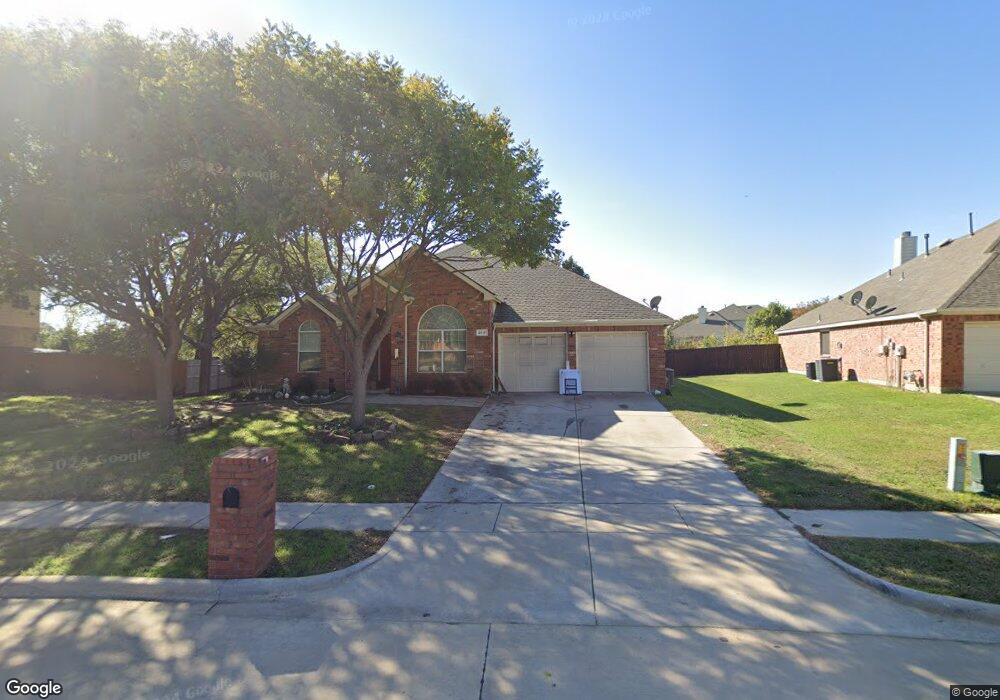
2616 Valencia Ln Denton, TX 76210
South Denton NeighborhoodEstimated Value: $395,628 - $422,000
4
Beds
2
Baths
2,362
Sq Ft
$175/Sq Ft
Est. Value
About This Home
This home is located at 2616 Valencia Ln, Denton, TX 76210 and is currently estimated at $412,657, approximately $174 per square foot. 2616 Valencia Ln is a home located in Denton County with nearby schools including Houston Elementary School, McMath Middle School, and Denton High School.
Ownership History
Date
Name
Owned For
Owner Type
Purchase Details
Closed on
Jul 29, 2024
Sold by
Jourdan Keith
Bought by
Jourdan Brandon
Current Estimated Value
Purchase Details
Closed on
May 11, 2015
Sold by
Hill Darrell C and Hill Noel L
Bought by
Jourdan Keith and Jourdan Brandon
Purchase Details
Closed on
Jan 28, 2010
Sold by
Studdert Ronald W
Bought by
Hill Darrell C and Hill Noel L
Home Financials for this Owner
Home Financials are based on the most recent Mortgage that was taken out on this home.
Original Mortgage
$140,250
Interest Rate
5.08%
Mortgage Type
New Conventional
Purchase Details
Closed on
Apr 15, 2003
Sold by
Lennar Homes Of Texas Land & Const Ltd
Bought by
Lennar Homes Of Texas Inc
Home Financials for this Owner
Home Financials are based on the most recent Mortgage that was taken out on this home.
Original Mortgage
$150,159
Interest Rate
5.57%
Mortgage Type
FHA
Create a Home Valuation Report for This Property
The Home Valuation Report is an in-depth analysis detailing your home's value as well as a comparison with similar homes in the area
Home Values in the Area
Average Home Value in this Area
Purchase History
| Date | Buyer | Sale Price | Title Company |
|---|---|---|---|
| Jourdan Brandon | -- | Title Resources | |
| Jourdan Keith | -- | Freedom Title | |
| Hill Darrell C | -- | Capital Title | |
| Lennar Homes Of Texas Inc | -- | -- | |
| Lennar Homes Of Texas Inc | -- | -- | |
| Hill Darrell C | -- | -- |
Source: Public Records
Mortgage History
| Date | Status | Borrower | Loan Amount |
|---|---|---|---|
| Previous Owner | Hill Darrell C | $140,250 | |
| Previous Owner | Hill Darrell C | $150,159 |
Source: Public Records
Tax History Compared to Growth
Tax History
| Year | Tax Paid | Tax Assessment Tax Assessment Total Assessment is a certain percentage of the fair market value that is determined by local assessors to be the total taxable value of land and additions on the property. | Land | Improvement |
|---|---|---|---|---|
| 2025 | $5,896 | $400,417 | $75,633 | $324,784 |
| 2024 | $7,091 | $367,378 | $0 | $0 |
| 2023 | $5,180 | $333,980 | $75,633 | $325,651 |
| 2022 | $6,445 | $303,618 | $75,633 | $263,205 |
| 2021 | $6,136 | $276,016 | $59,191 | $216,825 |
| 2020 | $5,941 | $259,902 | $59,191 | $200,711 |
| 2019 | $6,102 | $255,756 | $59,191 | $196,565 |
| 2018 | $5,822 | $241,000 | $59,191 | $181,809 |
| 2017 | $5,563 | $225,059 | $59,191 | $165,868 |
| 2016 | $5,020 | $211,550 | $39,461 | $172,089 |
| 2015 | $4,251 | $190,083 | $39,461 | $150,622 |
| 2014 | $4,251 | $180,499 | $39,461 | $141,038 |
| 2013 | -- | $174,682 | $39,461 | $135,221 |
Source: Public Records
Map
Nearby Homes
- 2501 Great Bear Ln
- 2312 Caddo Cir
- 2409 Loon Lake Rd
- 2505 Pioneer Dr
- 2600 Pioneer Dr
- 2508 Pioneer Dr
- 2209 Loon Lake Rd
- 2544 Natchez Trace
- 2009 Lake Fork Ct
- 2544 Richmond Ct
- 2000 Lamprey Cir
- 2713 Clubhouse Dr
- 3432 Sundown Blvd
- 2601 Pinto Dr
- 2272 Hollyhill Ln
- 2721 Arabian Ave
- 2253 Hollyhill Ln
- 3428 Tuscan Hills Cir
- 2617 Hereford Rd
- 2913 Montebello Dr
- 2612 Valencia Ln
- 2620 Valencia Ln
- 2624 Valencia Ln
- 2521 Great Bear Ln
- 3117 Saranac Cir
- 2613 Valencia Ln
- 3113 Saranac Cir
- 2608 Valencia Ln
- 2625 Valencia Ln
- 2517 Great Bear Ln
- 3109 Saranac Cir
- 2609 Valencia Ln
- 2628 Valencia Ln
- 3121 Saranac Cir
- 2513 Great Bear Ln
- 2604 Valencia Ln
- 2633 Valencia Ln
- 2632 Valencia Ln
- 2605 Valencia Ln
- 2509 Great Bear Ln