Estimated Value: $295,000 - $467,000
3
Beds
2
Baths
1,326
Sq Ft
$303/Sq Ft
Est. Value
About This Home
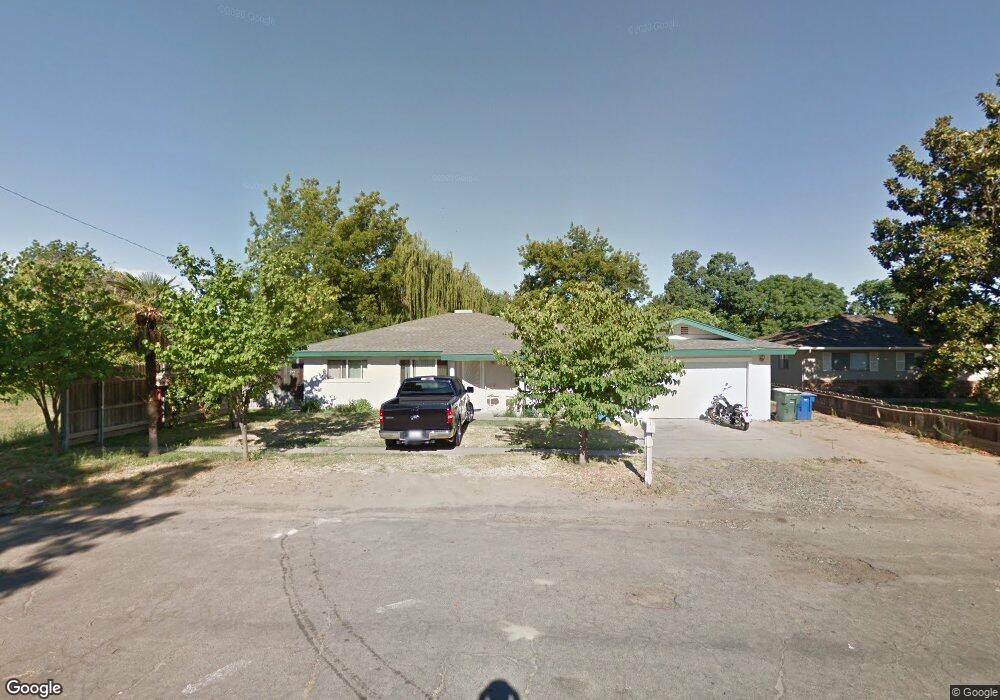
This home is located at 2617 Fiesta Way, Ceres, CA 95307 and is currently estimated at $402,055, approximately $303 per square foot. 2617 Fiesta Way is a home located in Stanislaus County with nearby schools including Sinclear Elementary School, Blaker-Kinser Junior High School, and Central Valley High School.
Ownership History
Date
Name
Owned For
Owner Type
Purchase Details
Closed on
Aug 2, 2010
Sold by
Open Views Inc
Bought by
Marquez David
Current Estimated Value
Purchase Details
Closed on
Jul 15, 2010
Sold by
Hall Lester A and Hall Judy C
Bought by
Open Views Inc
Purchase Details
Closed on
Sep 11, 2003
Sold by
Lucas Thomas R and Lucas Josephine E
Bought by
Hall Lester A and Hall Judy C
Home Financials for this Owner
Home Financials are based on the most recent Mortgage that was taken out on this home.
Original Mortgage
$204,750
Interest Rate
2.87%
Mortgage Type
Purchase Money Mortgage
Purchase Details
Closed on
May 21, 1996
Sold by
The Federal National Mtg Assn
Bought by
Lucas Thomas R and Lucas Josephine E
Home Financials for this Owner
Home Financials are based on the most recent Mortgage that was taken out on this home.
Original Mortgage
$72,650
Interest Rate
8.25%
Create a Home Valuation Report for This Property
The Home Valuation Report is an in-depth analysis detailing your home's value as well as a comparison with similar homes in the area
Home Values in the Area
Average Home Value in this Area
Purchase History
| Date | Buyer | Sale Price | Title Company |
|---|---|---|---|
| Marquez David | $102,000 | None Available | |
| Open Views Inc | $102,000 | None Available | |
| Hall Lester A | $227,500 | North American Title Ins Co | |
| Lucas Thomas R | $75,000 | Fidelity National Title Co |
Source: Public Records
Mortgage History
| Date | Status | Borrower | Loan Amount |
|---|---|---|---|
| Previous Owner | Hall Lester A | $204,750 | |
| Previous Owner | Lucas Thomas R | $72,650 |
Source: Public Records
Tax History Compared to Growth
Tax History
| Year | Tax Paid | Tax Assessment Tax Assessment Total Assessment is a certain percentage of the fair market value that is determined by local assessors to be the total taxable value of land and additions on the property. | Land | Improvement |
|---|---|---|---|---|
| 2024 | $1,437 | $128,103 | $50,236 | $77,867 |
| 2023 | $1,398 | $125,592 | $49,251 | $76,341 |
| 2022 | $1,386 | $123,131 | $48,286 | $74,845 |
| 2021 | $1,374 | $120,718 | $47,340 | $73,378 |
| 2020 | $1,332 | $119,481 | $46,855 | $72,626 |
| 2019 | $1,323 | $117,139 | $45,937 | $71,202 |
| 2018 | $1,296 | $114,843 | $45,037 | $69,806 |
| 2017 | $1,286 | $112,592 | $44,154 | $68,438 |
| 2016 | $1,260 | $110,386 | $43,289 | $67,097 |
| 2015 | $1,243 | $108,729 | $42,639 | $66,090 |
| 2014 | $1,217 | $106,600 | $41,804 | $64,796 |
Source: Public Records
Map
Nearby Homes
- 2873 Malik Ave
- 3116 Larrynell Dr
- 926 Alcoy Dr
- 3129 Malik Ave
- 3005 Willetts Way
- 3096 Castle Rock Ct
- 2617 E Whitmore Ave
- 2677 Ocaso Way
- 3501 Soda Canyon Dr
- 1429 Don Pedro Rd
- 1628 Sungate Dr
- 1432 Don Pedro Rd
- 1725 Norwood Heights Ln
- 1617 Heath Way
- 1724 Don Pedro Rd
- 2005 Pleasant Ave
- 1951 Darrah St Unit 1
- 3033 Railroad Ave
- 4080 Farm Supply Dr
- 805 Watson Ave
- 2613 Fiesta Way
- 2609 Fiesta Way
- 2616 Morgan Rd
- 2610 Morgan Rd
- 2700 Morgan Rd
- 2605 Fiesta Way
- 2604 Morgan Rd
- 2620 Fiesta Way
- 2612 Fiesta Way
- 2604 Fiesta Way
- 2600 Morgan Rd
- 2521 Fiesta Way
- 2716 Morgan Rd
- 2600 Fiesta Way
- 2530 Morgan Rd
- 2621 Cameron Park Dr
- 2517 Fiesta Way
- 2651 Cameron Park Dr
- 2681 Cameron Park Dr
- 2530 Fiesta Way