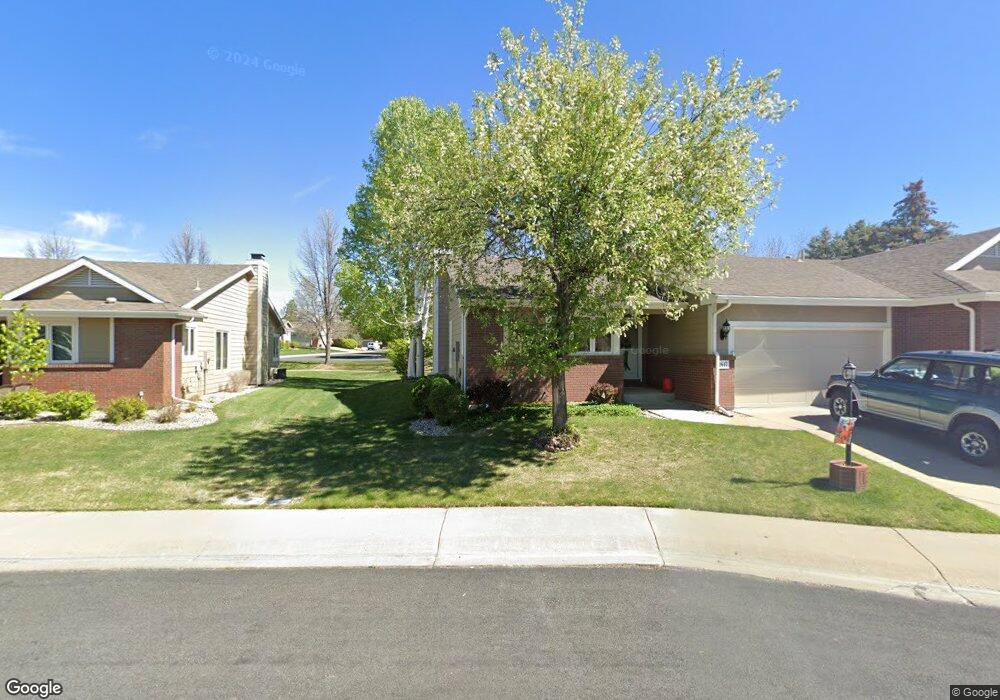
2617 Lochbuie Cir Loveland, CO 80538
Estimated Value: $428,339 - $521,000
3
Beds
3
Baths
1,283
Sq Ft
$371/Sq Ft
Est. Value
About This Home
This home is located at 2617 Lochbuie Cir, Loveland, CO 80538 and is currently estimated at $476,085, approximately $371 per square foot. 2617 Lochbuie Cir is a home located in Larimer County with nearby schools including Centennial Elementary School, Lucile Erwin Middle School, and Loveland High School.
Ownership History
Date
Name
Owned For
Owner Type
Purchase Details
Closed on
Nov 30, 1999
Sold by
Glackin Charles W Marjorie A
Bought by
Fraser David N and Fraser Dixie G
Current Estimated Value
Home Financials for this Owner
Home Financials are based on the most recent Mortgage that was taken out on this home.
Original Mortgage
$60,000
Interest Rate
7.93%
Purchase Details
Closed on
Nov 24, 1997
Sold by
Kem Homes Inc
Bought by
Glackin Charles W and Glackin Marjorie A
Home Financials for this Owner
Home Financials are based on the most recent Mortgage that was taken out on this home.
Original Mortgage
$62,000
Interest Rate
7.23%
Purchase Details
Closed on
Mar 1, 1996
Sold by
Glen Properties Inc
Bought by
Kem Homes Inc
Purchase Details
Closed on
Feb 1, 1996
Sold by
Security Title Guaranty Co Trustee
Bought by
Glen Properties Inc
Purchase Details
Closed on
Jun 1, 1995
Sold by
Security Title Guaranty Co Trustee
Bought by
Glen Properties Inc
Create a Home Valuation Report for This Property
The Home Valuation Report is an in-depth analysis detailing your home's value as well as a comparison with similar homes in the area
Home Values in the Area
Average Home Value in this Area
Purchase History
| Date | Buyer | Sale Price | Title Company |
|---|---|---|---|
| Fraser David N | $172,500 | North American Title Co | |
| Glackin Charles W | $151,447 | -- | |
| Kem Homes Inc | $54,000 | -- | |
| Glen Properties Inc | -- | -- | |
| Glen Properties Inc | $670,900 | -- |
Source: Public Records
Mortgage History
| Date | Status | Borrower | Loan Amount |
|---|---|---|---|
| Closed | Fraser David N | $60,000 | |
| Previous Owner | Glackin Charles W | $62,000 |
Source: Public Records
Tax History Compared to Growth
Tax History
| Year | Tax Paid | Tax Assessment Tax Assessment Total Assessment is a certain percentage of the fair market value that is determined by local assessors to be the total taxable value of land and additions on the property. | Land | Improvement |
|---|---|---|---|---|
| 2025 | $1,510 | $29,299 | $3,082 | $26,217 |
| 2024 | $1,456 | $29,299 | $3,082 | $26,217 |
| 2022 | $1,302 | $23,310 | $3,197 | $20,113 |
| 2021 | $1,338 | $23,981 | $3,289 | $20,692 |
| 2020 | $1,333 | $23,910 | $3,289 | $20,621 |
| 2019 | $1,310 | $23,910 | $3,289 | $20,621 |
| 2018 | $1,142 | $21,074 | $3,312 | $17,762 |
| 2017 | $983 | $21,074 | $3,312 | $17,762 |
| 2016 | $761 | $18,332 | $3,662 | $14,670 |
| 2015 | $754 | $18,330 | $3,660 | $14,670 |
| 2014 | $667 | $16,830 | $3,300 | $13,530 |
Source: Public Records
Map
Nearby Homes
- 2465 Glen Isle Dr
- 2554 W 44th St
- 3890 Kremmling Dr
- 2643 W 45th St
- 3902 Penrose Ave
- 2250 W 44th St
- 2684 W 46th St
- 2597 W 46th St
- 4559 Keota Place
- 4106 Cripple Creek Dr
- 2617 W 36th St
- 2070 Tonopas Ct
- 3007 Benfold St
- 2960 Kincaid Dr Unit 303
- 3679 Wild Horse Ct Unit 3679
- 3477 Pinecliffe Ave
- 2920 Donatello St
- 4719 Degas Dr
- 3017 Thorn Cir
- 2958 Donatello St
- 2617 Lochbuie Cir
- 2625 Lochbuie Cir
- 2633 Lochbuie Cir
- 2620 Lochbuie Cir
- 2612 Lochbuie Cir
- 2628 Lochbuie Cir
- 2641 Lochbuie Cir
- 2604 Lochbuie Cir
- 2613 Glen Isle Dr
- 2597 Glen Isle Dr
- 2636 Lochbuie Cir
- 2575 Glen Isle Dr
- 2649 Lochbuie Cir
- 2596 Lochbuie Cir
- 2572 Lochbuie Cir
- 4109 Glen Isle Ct
- 2644 Lochbuie Cir
- 2580 Lochbuie Cir
- 2588 Lochbuie Cir
- 2553 Glen Isle Dr