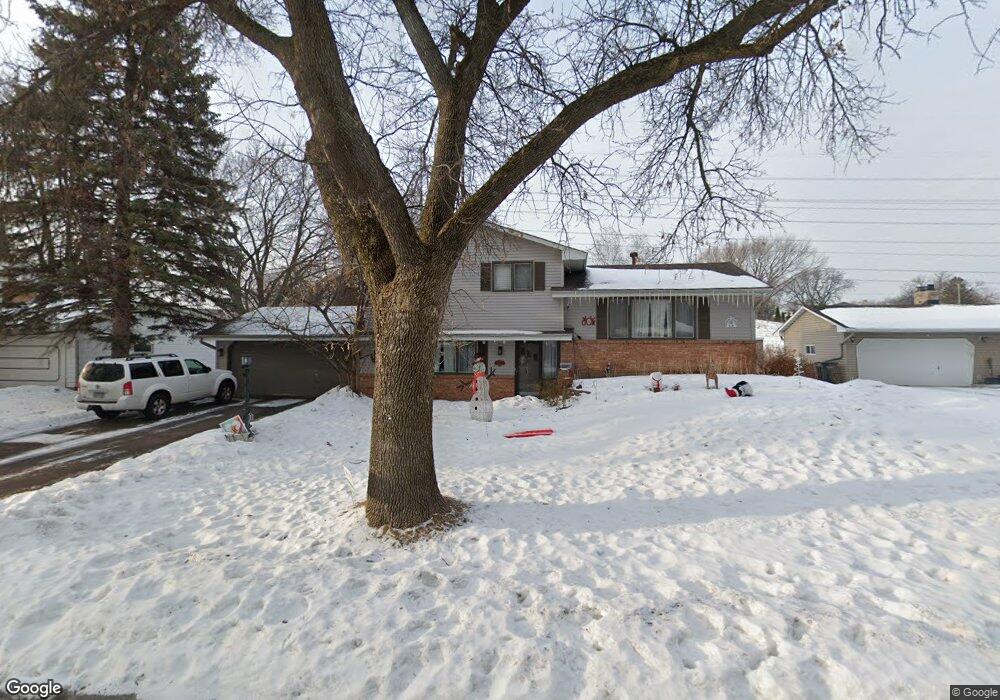
2617 London Ct Burnsville, MN 55337
Estimated Value: $379,400 - $400,000
3
Beds
2
Baths
1,792
Sq Ft
$220/Sq Ft
Est. Value
About This Home
This home is located at 2617 London Ct, Burnsville, MN 55337 and is currently estimated at $393,350, approximately $219 per square foot. 2617 London Ct is a home located in Dakota County with nearby schools including Burnsville High School, Gateway STEM Academy, and Sunrise International Montessori School.
Ownership History
Date
Name
Owned For
Owner Type
Purchase Details
Closed on
Aug 10, 2017
Sold by
Bhadrashetti Sheeba Y and Bhadrashetti Nikunj K
Bought by
Holweger Jeremy and Holweger Jennifer
Current Estimated Value
Home Financials for this Owner
Home Financials are based on the most recent Mortgage that was taken out on this home.
Original Mortgage
$255,487
Outstanding Balance
$213,586
Interest Rate
4.03%
Mortgage Type
New Conventional
Estimated Equity
$179,764
Purchase Details
Closed on
Sep 1, 2006
Sold by
Payne Monica T and Thomas Payne C
Bought by
Yesuraja Sheeba Y and Bhadrashetti Nikunj
Purchase Details
Closed on
Jul 24, 1998
Sold by
Fischer Thomas S and Fischer Diana F
Bought by
Payne C Thomas and Payne Monica T
Purchase Details
Closed on
Jul 1, 1998
Sold by
Fischer Thomas S and Fischer Diana F
Bought by
Payne C Thomas and Payne Monica T
Create a Home Valuation Report for This Property
The Home Valuation Report is an in-depth analysis detailing your home's value as well as a comparison with similar homes in the area
Home Values in the Area
Average Home Value in this Area
Purchase History
| Date | Buyer | Sale Price | Title Company |
|---|---|---|---|
| Holweger Jeremy | $268,933 | Home Title Inc | |
| Yesuraja Sheeba Y | $256,000 | -- | |
| Payne C Thomas | $138,500 | -- | |
| Payne C Thomas | $138,500 | -- |
Source: Public Records
Mortgage History
| Date | Status | Borrower | Loan Amount |
|---|---|---|---|
| Open | Holweger Jeremy | $255,487 | |
| Closed | Payne C Thomas | -- |
Source: Public Records
Tax History Compared to Growth
Tax History
| Year | Tax Paid | Tax Assessment Tax Assessment Total Assessment is a certain percentage of the fair market value that is determined by local assessors to be the total taxable value of land and additions on the property. | Land | Improvement |
|---|---|---|---|---|
| 2024 | $3,650 | $348,200 | $87,500 | $260,700 |
| 2023 | $3,650 | $351,200 | $87,600 | $263,600 |
| 2022 | $3,042 | $343,700 | $87,400 | $256,300 |
| 2021 | $2,982 | $291,400 | $76,000 | $215,400 |
| 2020 | $2,940 | $272,500 | $68,600 | $203,900 |
| 2019 | $2,830 | $260,100 | $65,400 | $194,700 |
| 2018 | $2,744 | $240,100 | $62,200 | $177,900 |
| 2017 | $2,480 | $227,300 | $59,300 | $168,000 |
| 2016 | $2,536 | $205,100 | $56,500 | $148,600 |
| 2015 | $2,366 | $182,504 | $49,609 | $132,895 |
| 2014 | -- | $177,490 | $48,472 | $129,018 |
| 2013 | -- | $156,780 | $43,423 | $113,357 |
Source: Public Records
Map
Nearby Homes
- 11115 Carver Ct
- 11017 27th Ave S
- 11036 27th Ave S
- 2329 Explorer Ct
- 10934 Southview Dr
- 3108 Foxpoint Cir
- 2001 Woods Ln
- 3113 Chandler Ct
- 11311 W River Hills Dr
- 4165 Old Sibley Hwy
- 11459 Galtier Dr
- 1601 Raleigh Dr
- 3017 Mcleod St
- 2177 Cool Stream Cir
- 4413 Slater Rd
- 4427 Cinnamon Ridge Cir
- 4425 Cinnamon Ridge Cir
- 4463 Cinnamon Ridge Cir
- 2200 Horizon Rd
- 11902 River Hills Cir
- 2613 London Ct
- 2621 London Ct
- 2609 London Ct
- 2616 London Ct
- 2625 London Ct
- 2612 London Ct
- 2608 London Ct
- 2620 London Ct
- 2629 London Ct
- 2605 London Ct
- 10912 27th Ave S
- 2604 London Ct
- 11111 Carver Ct
- 11004 27th Ave S
- 10908 27th Ave S
- 10904 27th Ave S
- 2600 London Ct
- 11113 Carver Ct
- 11109 Carver Ct
- 2601 London Ct