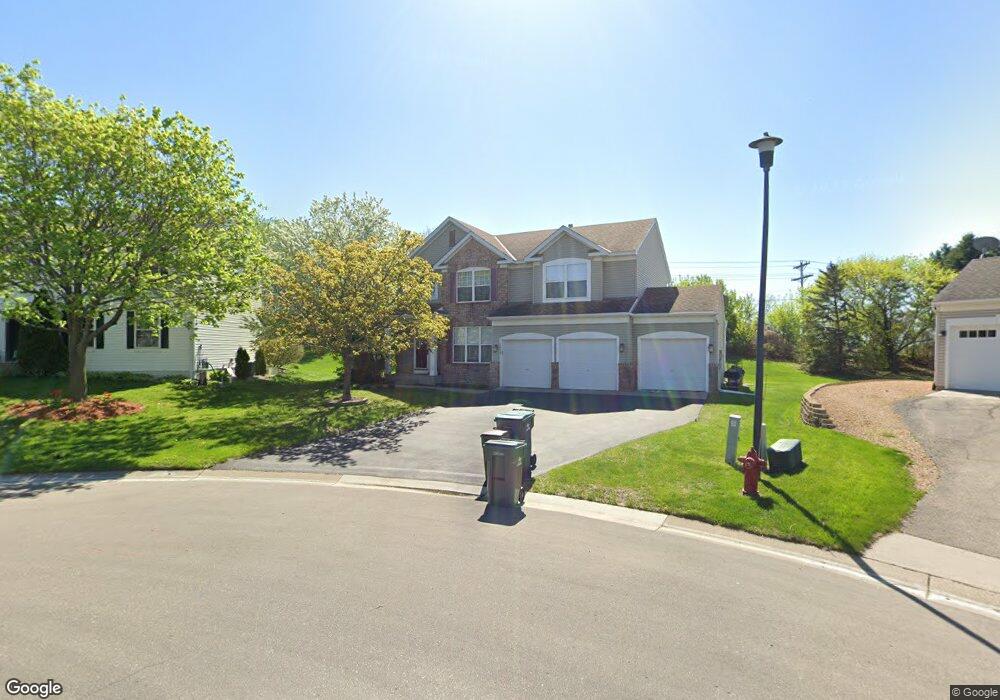
2617 Rachel Ct Chaska, MN 55318
Estimated Value: $492,409 - $543,000
4
Beds
3
Baths
2,240
Sq Ft
$231/Sq Ft
Est. Value
About This Home
This home is located at 2617 Rachel Ct, Chaska, MN 55318 and is currently estimated at $517,602, approximately $231 per square foot. 2617 Rachel Ct is a home located in Carver County with nearby schools including Jonathan Elementary School, Chaska Middle School East, and Chaska High School.
Ownership History
Date
Name
Owned For
Owner Type
Purchase Details
Closed on
Feb 20, 2020
Sold by
Pond Kathryn and Pond Joshua
Bought by
Regan Marc Allen and Regan Abby Belle
Current Estimated Value
Home Financials for this Owner
Home Financials are based on the most recent Mortgage that was taken out on this home.
Original Mortgage
$354,825
Interest Rate
3.3%
Mortgage Type
New Conventional
Purchase Details
Closed on
Oct 3, 2016
Sold by
Rowe Erick and Rowe Tonia
Bought by
Pond Joshua and Pond Kathryn
Home Financials for this Owner
Home Financials are based on the most recent Mortgage that was taken out on this home.
Original Mortgage
$318,250
Interest Rate
3.5%
Mortgage Type
New Conventional
Purchase Details
Closed on
May 26, 2000
Sold by
Diles Dennis and Diles Beverly
Bought by
Rowe Erick and Rowe Tonia
Purchase Details
Closed on
Aug 29, 1997
Sold by
The Ryland Group Inc
Bought by
Diles Dennis M and Diles Beverly M
Create a Home Valuation Report for This Property
The Home Valuation Report is an in-depth analysis detailing your home's value as well as a comparison with similar homes in the area
Home Values in the Area
Average Home Value in this Area
Purchase History
| Date | Buyer | Sale Price | Title Company |
|---|---|---|---|
| Regan Marc Allen | $373,500 | None Available | |
| Pond Joshua | $335,000 | Burnet Title | |
| Rowe Erick | $219,900 | -- | |
| Diles Dennis M | $200,100 | -- |
Source: Public Records
Mortgage History
| Date | Status | Borrower | Loan Amount |
|---|---|---|---|
| Previous Owner | Regan Marc Allen | $354,825 | |
| Previous Owner | Pond Joshua | $318,250 |
Source: Public Records
Tax History Compared to Growth
Tax History
| Year | Tax Paid | Tax Assessment Tax Assessment Total Assessment is a certain percentage of the fair market value that is determined by local assessors to be the total taxable value of land and additions on the property. | Land | Improvement |
|---|---|---|---|---|
| 2025 | $5,310 | $461,300 | $120,000 | $341,300 |
| 2024 | $5,172 | $447,200 | $120,000 | $327,200 |
| 2023 | $5,054 | $440,700 | $120,000 | $320,700 |
| 2022 | $4,488 | $449,500 | $106,100 | $343,400 |
| 2021 | $4,308 | $359,600 | $88,400 | $271,200 |
| 2020 | $4,378 | $358,400 | $88,400 | $270,000 |
| 2019 | $4,290 | $335,300 | $84,200 | $251,100 |
| 2018 | $4,246 | $335,300 | $84,200 | $251,100 |
| 2017 | $3,922 | $328,100 | $76,500 | $251,600 |
| 2016 | $4,242 | $306,000 | $0 | $0 |
| 2015 | $3,790 | $285,700 | $0 | $0 |
| 2014 | $3,790 | $260,700 | $0 | $0 |
Source: Public Records
Map
Nearby Homes
- 2740 Simons Dr
- 2888 Forest Ridge
- 2954 Ironwood Blvd
- 9630 Independence Cir Unit 201
- 2906 Butternut Dr
- 2890 Autumn Woods Dr
- 1840 Freedom Ln Unit 104
- 9580 Madison Dr Unit 4
- 1820 Plymouth Ln Unit 5
- 1826 Colonial Ln Unit 4
- 1191 Wildwood Ct
- 1078 Overlook Dr
- The Cypress Patio Plan at Pioneer Ridge - Patio Villas
- The Elm Patio Plan at Pioneer Ridge - Patio Villas
- The Jasmine Plan at Pioneer Ridge - Townhomes
- The Cedar Patio Plan at Pioneer Ridge - Patio Villas
- The Isla Plan at Pioneer Ridge - Townhomes
- 3019 Sugar Maple Dr
- 3015 Sugar Maple Dr
- 3124 Sugar Maple Dr
- 2619 Rachel Ct
- 2613 Rachel Ct
- 2608 Rachel Ct
- 2629 Rachel Ct
- 2610 Rachel Ct
- 27XX Wagner Dr
- 2637 Rachel Ct
- 2614 Rachel Ct
- 2626 Rachel Ct
- 2639 Rachel Ct
- 2630 Rachel Ct
- 2705 Autumn Woods Dr
- 2700 Autumn Woods Dr
- 2713 Autumn Woods Dr
- 2704 Autumn Woods Dr
- 2708 Autumn Woods Dr
- 2710 Autumn Woods Dr
- 2742 Shadow Wood Ct
- 2731 Wagner Dr
- 2642 Shadow Ln