NOT LISTED FOR SALE

2617 W Sesame St Dunlap, IL 61525

Estimated Value: $222,868 - $362,000

3 Beds
2 Baths
1,460 Sq Ft
$215/Sq Ft Est. Value

Last Sold September 25, 2012

Last sale price $215,000 $147 Per Sq Ft

Est. 46% increase in value since last sale

Current estimated payment $2,184/month

Highlights

  • Ranch Style House
  • Cathedral Ceiling
  • Garage
  • Hickory Grove Elementary School Rated A
  • Patio

About This Home

As of September 2012

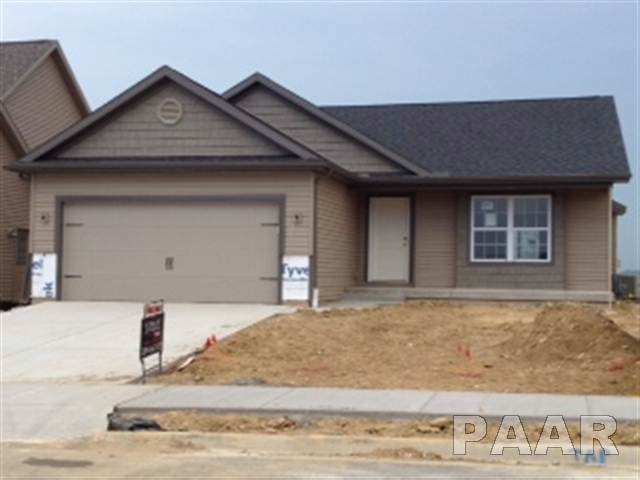
ANOTHER FABULOUS STELLE HOME. GREAT FLOOR PLAN FOR ENTERTAINING. FABULOUS MASTER SUITE WITH WALK-IN CLOSET. CLOSE TO BRAND NEW ELEMENTARY SCHOOL (DUNLAP). ATTACHED 2-CAR GARAGE.NEIGHBORHOOD PARK COMING SOON. GREAT PRICE FOR NEW CONSTRUCTION IN DUNLAP SCHOOL DISTRICT.

Last Agent to Sell the Property

Mari Halliday

Jim Maloof Realty, Inc. License #475131164 Listed on: 05/16/2012

Jim Maloof Realty, Inc.

Last Buyer's Agent

Marilyn Kohn

RE/MAX Traders Unlimited License #475100449

RE/MAX Traders Unlimited

Home Details

Home Type

  • Single Family

Est. Annual Taxes

  • $6,312

Year Built

  • Built in 2012

Lot Details

  • 6,534

Home Design

  • Ranch Style House

Interior Spaces

  • 2 Full Bathrooms
  • Cathedral Ceiling

Kitchen

  • Oven or Range
  • Range Hood
  • Microwave
  • Dishwasher
  • Disposal

Parking

  • Garage
  • Garage Door Opener

Outdoor Features

  • Patio

Schools

  • Dunlap Elementary School

Home Details

Home Type

Single Family

Est. Annual Taxes

$6,312

Year Built

Built in 2012

Lot Details

0

Listing Details

  • Class: Residential
  • Type: Single Family
  • Style: Ranch
  • Legal Description: LOT 320 WYNNCREST III
  • New Construction: Yes
  • Year Built: 2012
  • Special Features: None
  • Property Sub Type: Detached

Interior Features

  • Appliances: Dishwasher, Disposal, Hood/Fan, Microwave Oven, Range/Oven
  • Fireplace: Gas Lighter, Great Room
  • Interior Amenities: Ceilings/Cath/Vault/Tray, Garage Door Opener(s)
  • Number Fireplaces: 1
  • Total Bathrooms: 2
  • Total Full Baths: 2
  • Number of Main Level Full Bathrooms: 2
  • Bedrooms: 3
  • Master Bedroom: Dimensions: 13x14, On Level: Main, Flooring: Carpet
  • Basement Foundation: Full
  • Bedroom 2: Dimensions: 11x11, On Level: Main, Flooring: Carpet
  • Bedroom 3: Dimensions: 11x12, On Level: Main, Flooring: Carpet
  • Formal Dining Room: Dimensions: 11x16, On Level: Main, Flooring: Hardwood
  • Great Room: Dimensions: 21x15, On Level: Main, Flooring: Carpet
  • Informal Dining Room: Dimensions: 6x12, On Level: Main, Flooring: Tile
  • Kitchen: Dimensions: 12x12, On Level: Main, Flooring: Tile
  • Kitchen Dining: Dining Formal, Dining Informal, Eat-In Kitchen
  • Laundry: Dimensions: 6x3, On Level: Main, Flooring: Tile
  • Total Basement Sq Ft: 1235
  • Price Per Sq Ft: 147.26
  • Finished Sq Ft: 1460
  • Total Sq Ft: 1460
  • Finished Main Level Sq Ft: 1460

Exterior Features

  • Exterior: Vinyl Siding, Stone
  • Exterior Amenities: Patio
  • Road Access: Curbs & Gutters, Paved
  • Roofing: Shingles

Garage/Parking

  • Garage Parking: Attached
  • Garage Yn: Yes
  • Number Cars: 2

Utilities

  • Heating Cooling: Gas, Forced Air, Central Air
  • Water Sewer: Public Water, Public Sewer

Schools

  • Elementary School: Dunlap
  • Middle School: Dunlap Middle
  • High School: Dunlap
  • Elementary School: Dunlap

Lot Info

  • Estimated Lot Size: 55x120
  • Lot Description: Level
  • Subdivision: Wynncrest

Tax Info

  • Annual Taxes: 59.38
  • Parcel Id Number Tax Id: 0930127008
  • Tax Year: 2011

MLS Schools

  • High School School District: Dunlap
  • Middle School: Dunlap Middle

Range of Values:

Collateral Analytics

Collateral Analytics Collateral Analytics AVMs (Automated Valuation Model) employ a number of statistical approaches combined with neighborhood-specific comparable selection guarantees the most up-to-date and precise valuations.

Not Available

Collateral Analytics does not have data for the current month. Please view the chart for historical values.

ICE

ICE Mortgage Technology ICE Mortgage Technology’s AVM (Automated Valuation Model) is a state-of-the-art online residential property valuation tool that provides a quick and accurate estimate of the value of almost any home in the U.S.

Not Available

ICE Mortgage Technology does not have data for the current month. Please view the chart for historical values.

First American

First American First American Data & Analytics’ next-generation AVM combines unrivaled data assets with a blended ensemble of valuation models to produce highly accurate, reliable valuations you can trust.

Not Available

First American does not have data for the current month. Please view the chart for historical values.

Quantarium

Quantarium Quantarium’s valuation service, repeatedly proven the industry’s most accurate and comprehensive, is supercharged with a self-learning and auto-tuning AI engine that continually becomes smarter and more accurate as it processes daily inputs from the industry’s leading RE data lake.

Not Available

Quantarium does not have data for the current month. Please view the chart for historical values.

Average Value
Not Available
List Price
Sold Price
Create a Home Valuation Report for This Property
The Home Valuation Report is an in-depth analysis detailing your home's value as well as a comparison with similar homes in the area

Home Values in the Area

Source: Public Records

Average Home Value in this Area


Source: Public Records

Property History

Date Event Price Change Sq Ft Price
09/25/2012 09/25/12 Sold $215,000 -2.2% $147 / Sq Ft
08/21/2012 08/21/12 Pending -- -- --
05/16/2012 05/16/12 For Sale $219,900 -- $151 / Sq Ft
Source: RMLS Alliance

Tax History Compared to Growth

Source: Public Records

Tax History

Year Tax Paid Tax Assessment Tax Assessment Total Assessment is a certain percentage of the fair market value that is determined by local assessors to be the total taxable value of land and additions on the property. Land Improvement
2024 $6,312 $80,400 $18,070 $62,330
2023 $6,026 $76,570 $17,210 $59,360
2022 $5,709 $72,150 $16,210 $55,940
2021 $5,485 $68,720 $15,440 $53,280
2020 $5,460 $68,040 $15,290 $52,750
2019 $5,622 $70,140 $15,760 $54,380
2018 $5,896 $74,120 $15,740 $58,380
2017 $6,118 $76,420 $16,230 $60,190
2016 $5,987 $76,420 $16,230 $60,190
2015 $5,599 $74,200 $15,760 $58,440
2014 $5,539 $73,300 $15,570 $57,730
2013 -- $72,580 $15,420 $57,160
Source: Public Records

Agents Affiliated with this Home

  • Section Image
  • Section Image
See All Agents

Map

Source: RMLS Alliance

MLS Number: RMAPA1135569

RMLS Alliance

APN: 09-30-127-008