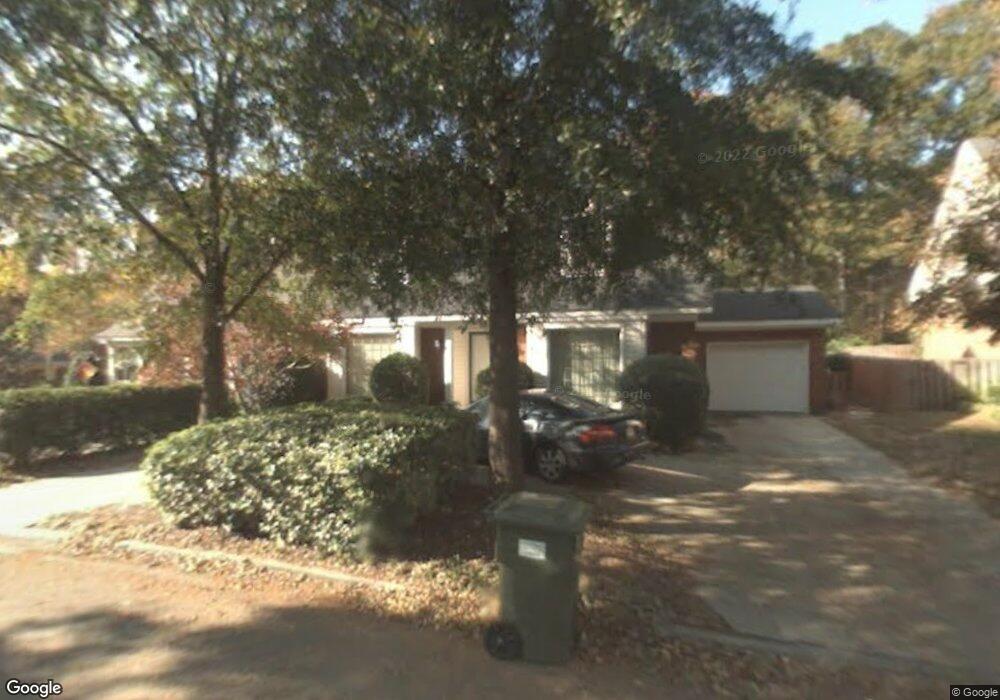
2617 Woodbluff Cir Augusta, GA 30909
West Augusta NeighborhoodEstimated Value: $301,091 - $320,000
3
Beds
3
Baths
2,045
Sq Ft
$151/Sq Ft
Est. Value
About This Home
This home is located at 2617 Woodbluff Cir, Augusta, GA 30909 and is currently estimated at $309,523, approximately $151 per square foot. 2617 Woodbluff Cir is a home located in Richmond County with nearby schools including First Coast Technical Institute, R.B. Hunt Elementary School, and A. Brian Merry Elementary School.
Ownership History
Date
Name
Owned For
Owner Type
Purchase Details
Closed on
Mar 4, 2014
Sold by
Climer Freddie M
Bought by
Climer Brenda B
Current Estimated Value
Purchase Details
Closed on
Jan 10, 2012
Sold by
Climer Brenda B
Bought by
Climer Fred M
Purchase Details
Closed on
Apr 7, 2009
Sold by
Climer Fred M
Bought by
Climer Brenda B
Purchase Details
Closed on
Mar 7, 2008
Sold by
Boatwright Ann G
Bought by
Climer Fred M and Climer Brenda B
Home Financials for this Owner
Home Financials are based on the most recent Mortgage that was taken out on this home.
Original Mortgage
$128,700
Interest Rate
5.63%
Mortgage Type
Purchase Money Mortgage
Purchase Details
Closed on
Sep 19, 1990
Sold by
Vaughn Jerry W
Bought by
Davis Alpheus M
Purchase Details
Closed on
Sep 17, 1990
Sold by
Vaughn Jerry W
Bought by
Davis Alpheus M
Create a Home Valuation Report for This Property
The Home Valuation Report is an in-depth analysis detailing your home's value as well as a comparison with similar homes in the area
Home Values in the Area
Average Home Value in this Area
Purchase History
| Date | Buyer | Sale Price | Title Company |
|---|---|---|---|
| Climer Brenda B | -- | -- | |
| Climer Fred M | -- | -- | |
| Climer Brenda B | -- | None Available | |
| Climer Fred M | -- | None Available | |
| Davis Alpheus M | $119,500 | -- | |
| Davis Alpheus M | $119,500 | -- |
Source: Public Records
Mortgage History
| Date | Status | Borrower | Loan Amount |
|---|---|---|---|
| Previous Owner | Climer Fred M | $128,700 |
Source: Public Records
Tax History Compared to Growth
Tax History
| Year | Tax Paid | Tax Assessment Tax Assessment Total Assessment is a certain percentage of the fair market value that is determined by local assessors to be the total taxable value of land and additions on the property. | Land | Improvement |
|---|---|---|---|---|
| 2025 | $1,364 | $114,896 | $14,400 | $100,496 |
| 2024 | $1,364 | $116,028 | $14,400 | $101,628 |
| 2023 | $1,336 | $103,276 | $14,400 | $88,876 |
| 2022 | $1,269 | $89,330 | $14,400 | $74,930 |
| 2021 | $1,145 | $69,493 | $14,400 | $55,093 |
| 2020 | $1,152 | $69,493 | $14,400 | $55,093 |
| 2019 | $1,142 | $64,437 | $13,600 | $50,837 |
| 2018 | $1,148 | $64,437 | $13,600 | $50,837 |
| 2017 | $2,278 | $64,437 | $13,600 | $50,837 |
| 2016 | $2,280 | $64,437 | $13,600 | $50,837 |
| 2015 | $2,273 | $64,437 | $13,600 | $50,837 |
| 2014 | -- | $64,437 | $13,600 | $50,837 |
Source: Public Records
Map
Nearby Homes
- 2413 Woodbluff Ct
- 2703 Oakbluff Ct
- 3084 Westwood Rd
- 3082 Westwood Rd
- 3086 Westwood Rd
- 2507 Pinebluff Ct
- 2695 York Dr
- 2914 Westchester Dr
- 2918 Arrowhead Dr
- 2920 Sussex Rd
- 3129 Ramsgate Rd
- 46 Charlestowne Dr
- 3121 Ramsgate Rd
- 2901 Sussex Rd
- 2609 Sherborne Ct
- 503 Sheffield Dr
- 3129 Edinburgh Dr
- 3103 Clay Hill Dr
- 3144 Edinburgh Dr
- 2924 Mayfair Ct
- 2615 Woodbluff Cir
- 2619 Woodbluff Cir
- 2621 Woodbluff Cir
- 2608 Woodbluff Cir
- 2613 Woodbluff Cir
- 2606 Woodbluff Cir
- 2623 Woodbluff Cir
- 2610 Woodbluff Cir
- 2611 Woodbluff Cir
- 2604 Woodbluff Cir
- 2625 Woodbluff Cir
- 2205 Woodbluff Way
- 2602 Woodbluff Cir
- 2207 Woodbluff Way
- 3055 Westwood Rd
- 2609 Woodbluff Cir
- 2607 Woodbluff Cir
- 2605 Woodbluff Cir
- 3051 Westwood Rd
- 2603 Woodbluff Cir