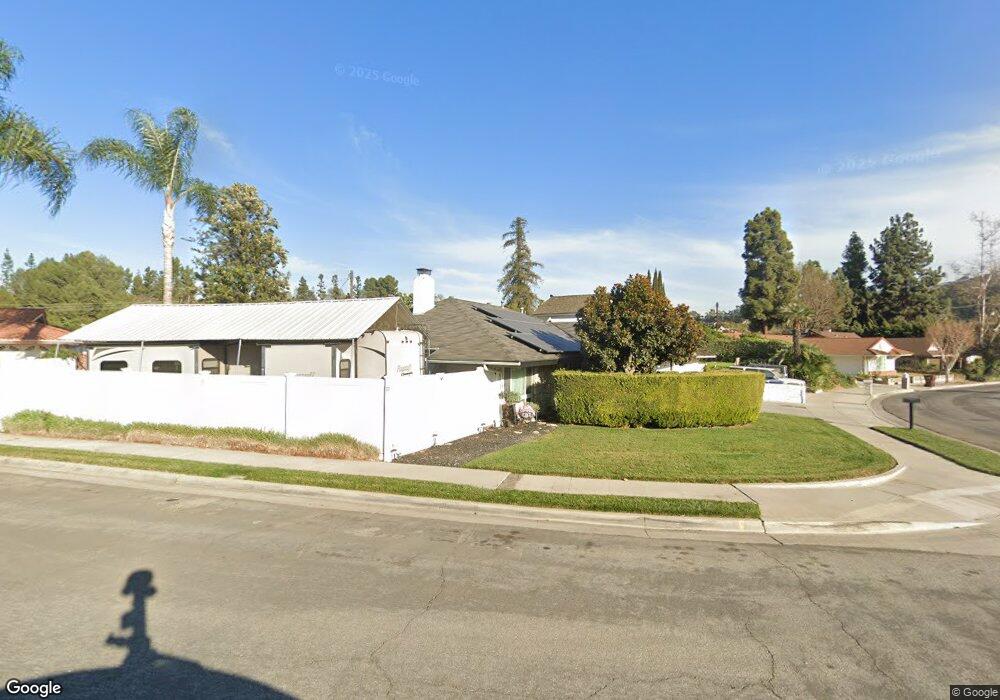
2618 Genola Dr Hacienda Heights, CA 91745
Estimated Value: $831,828 - $1,019,000
3
Beds
2
Baths
1,400
Sq Ft
$658/Sq Ft
Est. Value
About This Home
This home is located at 2618 Genola Dr, Hacienda Heights, CA 91745 and is currently estimated at $920,957, approximately $657 per square foot. 2618 Genola Dr is a home located in Los Angeles County with nearby schools including Grazide Elementary School, Mesa Robles School, and Glen A. Wilson High School.
Ownership History
Date
Name
Owned For
Owner Type
Purchase Details
Closed on
Feb 23, 2001
Sold by
Hill Lorraine H and Solorza Daniel
Bought by
Desatoff David D and Desatoff Susan J
Current Estimated Value
Home Financials for this Owner
Home Financials are based on the most recent Mortgage that was taken out on this home.
Original Mortgage
$231,830
Outstanding Balance
$85,489
Interest Rate
7.19%
Estimated Equity
$835,468
Purchase Details
Closed on
Jun 3, 1999
Sold by
Meng Hsin Yi
Bought by
Hill Lorraine H and Solorza Daniel
Home Financials for this Owner
Home Financials are based on the most recent Mortgage that was taken out on this home.
Original Mortgage
$161,600
Interest Rate
2.95%
Purchase Details
Closed on
Dec 30, 1996
Sold by
Meng Mei Yi and Meng Hsin Yi
Bought by
Meng Hsin Yi
Purchase Details
Closed on
Feb 28, 1996
Sold by
Meng Mei Yi and Meng Erh Tien
Bought by
Meng Mei Yi and Meng Hsin Yi
Create a Home Valuation Report for This Property
The Home Valuation Report is an in-depth analysis detailing your home's value as well as a comparison with similar homes in the area
Home Values in the Area
Average Home Value in this Area
Purchase History
| Date | Buyer | Sale Price | Title Company |
|---|---|---|---|
| Desatoff David D | $239,000 | South Coast Title | |
| Hill Lorraine H | $202,000 | Fidelity Title | |
| Meng Hsin Yi | -- | -- | |
| Meng Mei Yi | -- | -- |
Source: Public Records
Mortgage History
| Date | Status | Borrower | Loan Amount |
|---|---|---|---|
| Open | Desatoff David D | $231,830 | |
| Previous Owner | Hill Lorraine H | $161,600 |
Source: Public Records
Tax History Compared to Growth
Tax History
| Year | Tax Paid | Tax Assessment Tax Assessment Total Assessment is a certain percentage of the fair market value that is determined by local assessors to be the total taxable value of land and additions on the property. | Land | Improvement |
|---|---|---|---|---|
| 2025 | $4,620 | $360,115 | $226,920 | $133,195 |
| 2024 | $4,620 | $353,055 | $222,471 | $130,584 |
| 2023 | $4,534 | $346,133 | $218,109 | $128,024 |
| 2022 | $4,403 | $339,347 | $213,833 | $125,514 |
| 2021 | $4,324 | $332,694 | $209,641 | $123,053 |
| 2019 | $4,200 | $322,828 | $203,424 | $119,404 |
| 2018 | $4,018 | $316,499 | $199,436 | $117,063 |
| 2016 | $3,718 | $304,211 | $191,693 | $112,518 |
| 2015 | $3,649 | $299,642 | $188,814 | $110,828 |
| 2014 | $3,592 | $293,774 | $185,116 | $108,658 |
Source: Public Records
Map
Nearby Homes
- 2719 S Stimson Ave
- 2809 Ilopango Dr
- 16060 Villa Flores Dr
- 2440 Amelgado Dr
- 2424 Kiska Ave
- 2995 Leopold Ave
- 15949 Maracaibo Place
- 16182 Sierra Pass Way
- 16311 Sierra Trail Ct
- 16325 Sierra Trail Ct
- 16109 Mesa Robles Dr
- 15751 La Moine St
- 16390 Gregorio Dr
- 2300 S Hacienda Blvd Unit D11
- 2300 S Hacienda Blvd Unit C2
- 2300 S Hacienda Blvd Unit B2
- 15712 Los Altos Dr
- 15813 Lonecrest Dr
- 2082 Salto Dr
- 16495 Canelones Dr
- 2624 Genola Dr
- 2604 Genola Dr
- 2619 Allenton Ave
- 2632 Genola Dr
- 2625 Genola Dr
- 2603 Genola Dr
- 2620 Allenton Ave
- 2625 Allenton Ave
- 2635 Genola Dr
- 2640 Genola Dr
- 2639 Sarandi Grande Dr
- 2647 Sarandi Grande Dr
- 2631 Sarandi Grande Dr
- 2600 Genola Dr
- 2660 Ticatica Dr
- 2632 Allenton Ave
- 2653 Sarandi Grande Dr
- 2712 Fabueno Dr
- 2656 Ticatica Dr
- 2633 Allenton Ave