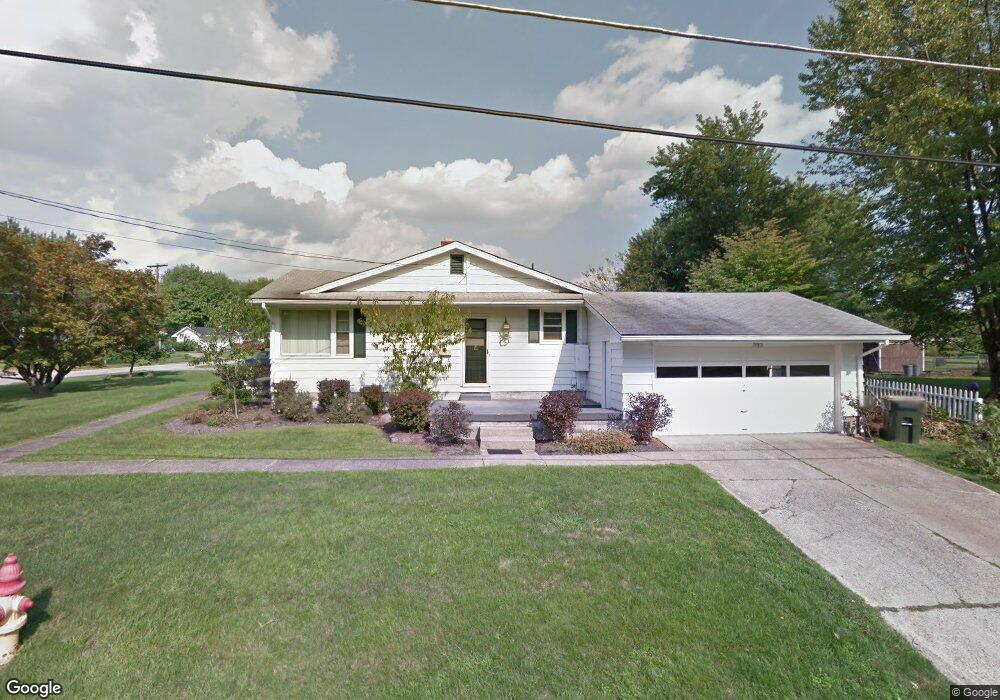
2619 Algonquin Dr Youngstown, OH 44514
Estimated Value: $187,216 - $243,000
3
Beds
2
Baths
1,320
Sq Ft
$167/Sq Ft
Est. Value
About This Home
This home is located at 2619 Algonquin Dr, Youngstown, OH 44514 and is currently estimated at $220,804, approximately $167 per square foot. 2619 Algonquin Dr is a home located in Mahoning County with nearby schools including Poland Union Elementary School, Poland Middle School, and Poland Seminary High School.
Ownership History
Date
Name
Owned For
Owner Type
Purchase Details
Closed on
Jun 14, 2010
Sold by
Rudzik James and Rudzik Janice L
Bought by
Kuboff Marilyn S and Kuboff Stephen E
Current Estimated Value
Home Financials for this Owner
Home Financials are based on the most recent Mortgage that was taken out on this home.
Original Mortgage
$70,000
Outstanding Balance
$46,559
Interest Rate
5.13%
Mortgage Type
New Conventional
Estimated Equity
$174,245
Purchase Details
Closed on
Aug 28, 2007
Sold by
Old Stone Tavern Antiques Llc
Bought by
Rudzik Ii James and Rudzik Janice L
Home Financials for this Owner
Home Financials are based on the most recent Mortgage that was taken out on this home.
Original Mortgage
$131,120
Outstanding Balance
$82,031
Interest Rate
6.79%
Mortgage Type
Purchase Money Mortgage
Estimated Equity
$138,773
Purchase Details
Closed on
Mar 7, 2007
Sold by
Fender Shirley L
Bought by
Old Stone Tavern Antiques Llc
Purchase Details
Closed on
Jun 13, 1974
Bought by
Fender Shirley L
Create a Home Valuation Report for This Property
The Home Valuation Report is an in-depth analysis detailing your home's value as well as a comparison with similar homes in the area
Purchase History
| Date | Buyer | Sale Price | Title Company |
|---|---|---|---|
| Kuboff Marilyn S | $90,000 | Barristers Of Ohio | |
| Rudzik Ii James | $131,200 | Attorney | |
| Old Stone Tavern Antiques Llc | $76,500 | Attorney | |
| Fender Shirley L | -- | -- |
Source: Public Records
Mortgage History
| Date | Status | Borrower | Loan Amount |
|---|---|---|---|
| Open | Kuboff Marilyn S | $70,000 | |
| Open | Rudzik Ii James | $131,120 |
Source: Public Records
Tax History
| Year | Tax Paid | Tax Assessment Tax Assessment Total Assessment is a certain percentage of the fair market value that is determined by local assessors to be the total taxable value of land and additions on the property. | Land | Improvement |
|---|---|---|---|---|
| 2025 | $2,488 | $51,010 | $9,930 | $41,080 |
| 2024 | $2,560 | $51,010 | $9,930 | $41,080 |
| 2023 | $2,502 | $51,010 | $9,930 | $41,080 |
| 2022 | $2,298 | $39,170 | $9,930 | $29,240 |
| 2021 | $2,194 | $39,170 | $9,930 | $29,240 |
| 2020 | $2,204 | $39,170 | $9,930 | $29,240 |
| 2019 | $1,981 | $32,770 | $9,930 | $22,840 |
| 2018 | $1,812 | $32,770 | $9,930 | $22,840 |
| 2017 | $1,809 | $32,770 | $9,930 | $22,840 |
| 2016 | $2,017 | $34,710 | $9,930 | $24,780 |
| 2015 | $1,973 | $34,710 | $9,930 | $24,780 |
| 2014 | $1,981 | $34,710 | $9,930 | $24,780 |
| 2013 | $1,955 | $34,710 | $9,930 | $24,780 |
Source: Public Records
Map
Nearby Homes
- 6074 Frontier Dr
- 154 Rocky Ledge Dr
- 172 Lakeshore Dr
- 6534 Diana Dr
- 0 Clingan Rd Unit 4461196
- 2295 Bel Aire Ln
- 6137 Acatello Place
- 2350 Hamilton Ave
- 118 N Main St
- 2370 Lyon Blvd
- 43 Venloe Dr
- 232 Edna St
- 2153 Lyon Blvd
- 43 Greystone
- 2128 Lyon Blvd
- 6695 Clingan Rd Unit 24
- 6695 Clingan Rd Unit 10
- 6695 Clingan Rd Unit 32
- 6695 Clingan Rd Unit 4
- 627 Poland Ave
- 2631 Algonquin Dr
- 2645 Algonquin Dr
- 6137 Diana Dr
- 6102 Diana Dr
- 6118 Diana Dr
- 2663 Algonquin Dr
- 2602 Algonquin Dr
- 2606 Algonquin Dr
- 6153 Diana Dr
- 6090 Diana Dr
- 2612 Algonquin Dr
- 6146 Diana Dr
- 2622 Algonquin Dr
- 2646 Algonquin Dr
- 2679 Algonquin Dr
- 6197 Diana Dr
- 6162 Diana Dr
- 2658 Algonquin Dr
- 6108 Circle Dr
- 6168 Apache Ln
Your Personal Tour Guide
Ask me questions while you tour the home.