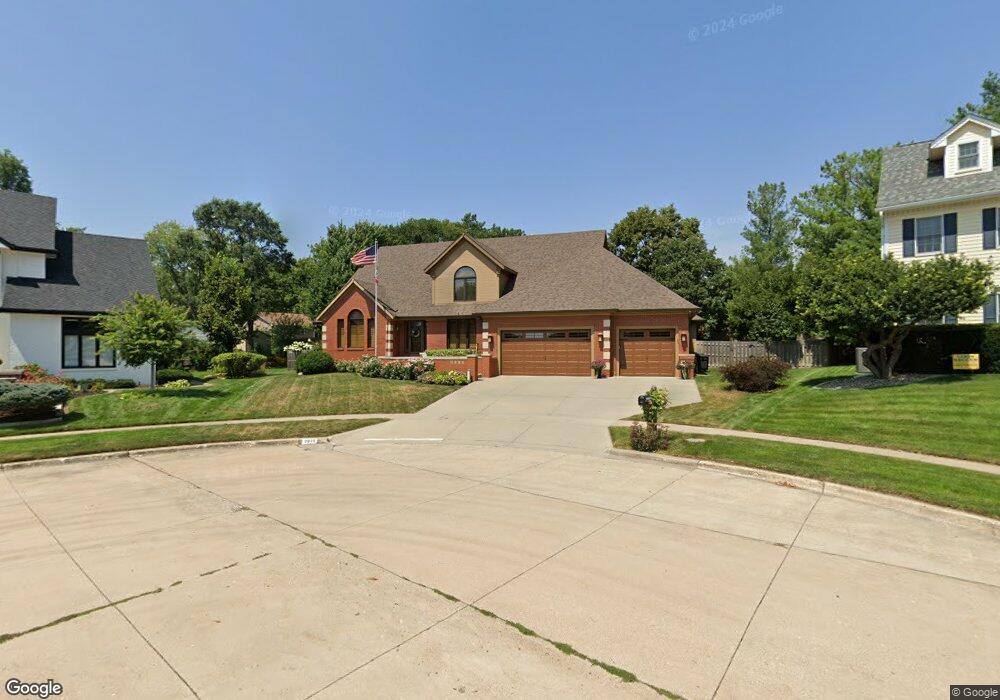
2619 Crown Flair Dr West Des Moines, IA 50265
Estimated Value: $624,061 - $861,000
4
Beds
6
Baths
4,281
Sq Ft
$170/Sq Ft
Est. Value
About This Home
This home is located at 2619 Crown Flair Dr, West Des Moines, IA 50265 and is currently estimated at $727,265, approximately $169 per square foot. 2619 Crown Flair Dr is a home located in Polk County with nearby schools including Fairmeadows Elementary School, Stilwell Junior High School, and Valley Southwoods Freshman High School.
Ownership History
Date
Name
Owned For
Owner Type
Purchase Details
Closed on
Aug 22, 2001
Sold by
Earlham Svgs Bank
Bought by
Milligan George D
Current Estimated Value
Home Financials for this Owner
Home Financials are based on the most recent Mortgage that was taken out on this home.
Original Mortgage
$250,000
Outstanding Balance
$97,239
Interest Rate
7.11%
Estimated Equity
$630,026
Purchase Details
Closed on
Dec 19, 2000
Sold by
Moyer James L and Moyer Beverly L
Bought by
Earlham Svgs Bank
Create a Home Valuation Report for This Property
The Home Valuation Report is an in-depth analysis detailing your home's value as well as a comparison with similar homes in the area
Home Values in the Area
Average Home Value in this Area
Purchase History
| Date | Buyer | Sale Price | Title Company |
|---|---|---|---|
| Milligan George D | $384,500 | -- | |
| Earlham Svgs Bank | -- | -- |
Source: Public Records
Mortgage History
| Date | Status | Borrower | Loan Amount |
|---|---|---|---|
| Open | Milligan George D | $250,000 |
Source: Public Records
Tax History Compared to Growth
Tax History
| Year | Tax Paid | Tax Assessment Tax Assessment Total Assessment is a certain percentage of the fair market value that is determined by local assessors to be the total taxable value of land and additions on the property. | Land | Improvement |
|---|---|---|---|---|
| 2025 | $9,112 | $677,500 | $93,500 | $584,000 |
| 2024 | $9,112 | $592,300 | $80,700 | $511,600 |
| 2023 | $9,118 | $592,300 | $80,700 | $511,600 |
| 2022 | $9,010 | $481,100 | $68,700 | $412,400 |
| 2021 | $9,764 | $481,100 | $68,700 | $412,400 |
| 2020 | $9,614 | $495,500 | $70,600 | $424,900 |
| 2019 | $9,236 | $495,500 | $70,600 | $424,900 |
| 2018 | $9,254 | $459,400 | $64,100 | $395,300 |
| 2017 | $9,152 | $459,400 | $64,100 | $395,300 |
| 2016 | $8,950 | $441,500 | $60,800 | $380,700 |
| 2015 | $8,950 | $441,500 | $60,800 | $380,700 |
| 2014 | $8,388 | $422,500 | $57,300 | $365,200 |
Source: Public Records
Map
Nearby Homes