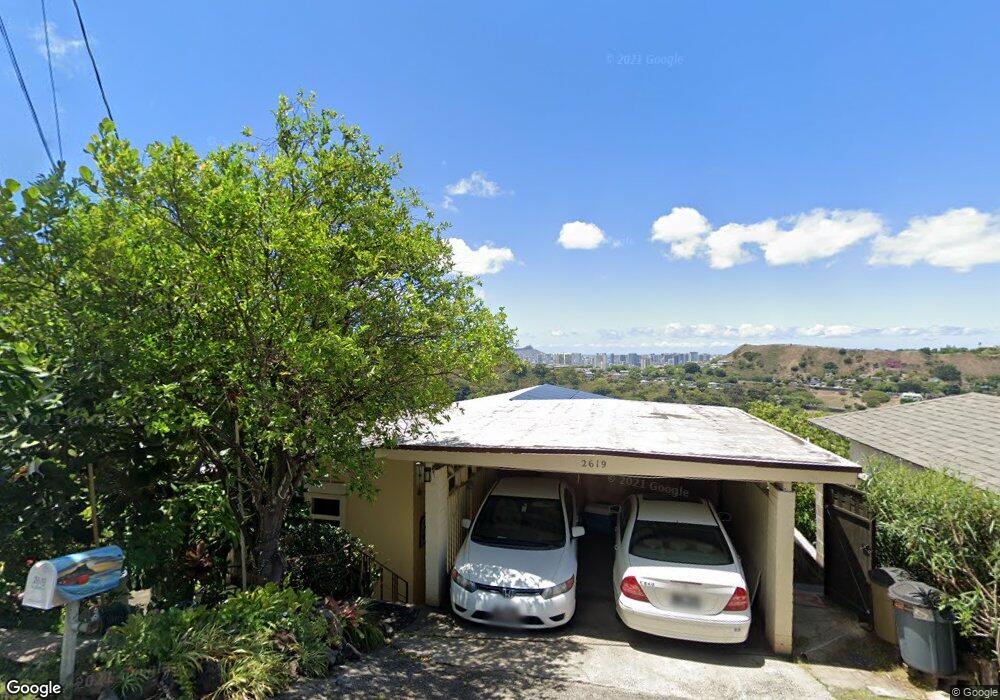
2619 Haili Rd Honolulu, HI 96813
Nuuanu-Punchbowl NeighborhoodEstimated Value: $1,266,268 - $1,851,000
5
Beds
2
Baths
1,155
Sq Ft
$1,268/Sq Ft
Est. Value
About This Home
This home is located at 2619 Haili Rd, Honolulu, HI 96813 and is currently estimated at $1,464,067, approximately $1,267 per square foot. 2619 Haili Rd is a home located in Honolulu County with nearby schools including Pauoa Elementary School, Prince David Kawananakoa Middle School, and President Theodore Roosevelt High School.
Ownership History
Date
Name
Owned For
Owner Type
Purchase Details
Closed on
Dec 20, 2011
Sold by
Peterman Leslee Reiko Ikeda and Ikeda Reid Ken
Bought by
Shanahan Mark D and Shanahan Roswitha J
Current Estimated Value
Home Financials for this Owner
Home Financials are based on the most recent Mortgage that was taken out on this home.
Original Mortgage
$520,000
Outstanding Balance
$354,346
Interest Rate
3.93%
Mortgage Type
New Conventional
Estimated Equity
$1,109,721
Purchase Details
Closed on
Oct 4, 2007
Sold by
Peterman Leslee Reiko Ikeda
Bought by
Peterman Leslee Reiko Ikeda and Ikeda Reid Ken
Purchase Details
Closed on
May 20, 2002
Sold by
Ikeda Myra Biju
Bought by
Ikeda Myra Biju and Myra Biju Ikeda Trust
Purchase Details
Closed on
Jul 23, 1998
Sold by
Ikeda Myra Biju
Bought by
Ikeda Myra Biju
Purchase Details
Closed on
Apr 12, 1994
Sold by
Kadota Richard Mitsuo
Bought by
Kadota Richard Mitsuo
Create a Home Valuation Report for This Property
The Home Valuation Report is an in-depth analysis detailing your home's value as well as a comparison with similar homes in the area
Home Values in the Area
Average Home Value in this Area
Purchase History
| Date | Buyer | Sale Price | Title Company |
|---|---|---|---|
| Shanahan Mark D | $650,000 | Fam | |
| Shanahan Mark D | $650,000 | Fam | |
| Peterman Leslee Reiko Ikeda | -- | None Available | |
| Ikeda Myra Biju | -- | -- | |
| Ikeda Myra Biju | -- | -- | |
| Kadota Richard Mitsuo | -- | -- |
Source: Public Records
Mortgage History
| Date | Status | Borrower | Loan Amount |
|---|---|---|---|
| Open | Shanahan Mark D | $520,000 | |
| Closed | Shanahan Mark D | $520,000 |
Source: Public Records
Tax History Compared to Growth
Tax History
| Year | Tax Paid | Tax Assessment Tax Assessment Total Assessment is a certain percentage of the fair market value that is determined by local assessors to be the total taxable value of land and additions on the property. | Land | Improvement |
|---|---|---|---|---|
| 2025 | $6,734 | $1,301,400 | $1,078,300 | $223,100 |
| 2024 | $6,734 | $1,239,800 | $1,052,600 | $187,200 |
| 2023 | $6,371 | $1,208,000 | $1,017,500 | $190,500 |
| 2022 | $3,465 | $990,100 | $814,000 | $176,100 |
| 2021 | $3,227 | $922,100 | $763,100 | $159,000 |
| 2020 | $3,467 | $990,600 | $850,800 | $139,800 |
| 2019 | $3,233 | $923,600 | $915,700 | $7,900 |
| 2018 | $4,514 | $1,001,600 | $915,700 | $85,900 |
| 2017 | $3,274 | $935,300 | $737,700 | $197,600 |
| 2016 | $2,821 | $806,100 | $575,100 | $231,000 |
| 2015 | $2,748 | $785,000 | $554,500 | $230,500 |
| 2014 | -- | $659,800 | $523,700 | $136,100 |
Source: Public Records
Map
Nearby Homes
- 2578 Pacific Heights Rd
- 2960 Laola Place Unit A
- 2771 Pacific Heights Rd
- 2453 Pacific Heights Rd Unit C
- 238 Naone St
- 2153 Booth Rd
- 3075 Pacific Heights Rd
- 2143 Booth Rd
- 2571 Kekuanoni St
- 2138 Kanealii Ave
- 2134 Kanealii Ave
- 3233 Pacific Heights Rd
- 21 Craigside Place Unit 8D
- 2101 Nuuanu Ave Unit I301
- 2101 Nuuanu Ave Unit I303
- 55 S Judd St Unit 803
- 55 S Judd St Unit 1901
- 55 S Judd St Unit 2206
- 55 S Judd St Unit 705
- 55 S Judd St Unit 1501
- 2629 Haili Rd
- 2582D Pacific Heights Rd Unit D
- 2582F Pacific Hts Rd
- 2613 Haili Rd
- 2582F Pacific Heights Rd
- 2654 Pacific Heights Rd
- 2637 Haili Rd
- 2612 Pacific Heights Rd
- 2330 Pacific Heights Rd
- 2650 Pacific Heights Rd
- 2650 Pacific Heights Rd Unit B
- 2649 Haili Rd
- 2643 Haili Rd
- 2340 Pacific Heights Rd Unit A
- 2340 Pacific Heights Rd
- 2340 Pacific Heights Rd Unit A
- 2610 Pacific Heights Rd
- 2316 Pacific Heights Rd
- 2646 Haili Rd
- 2683 Pacific Heights Rd