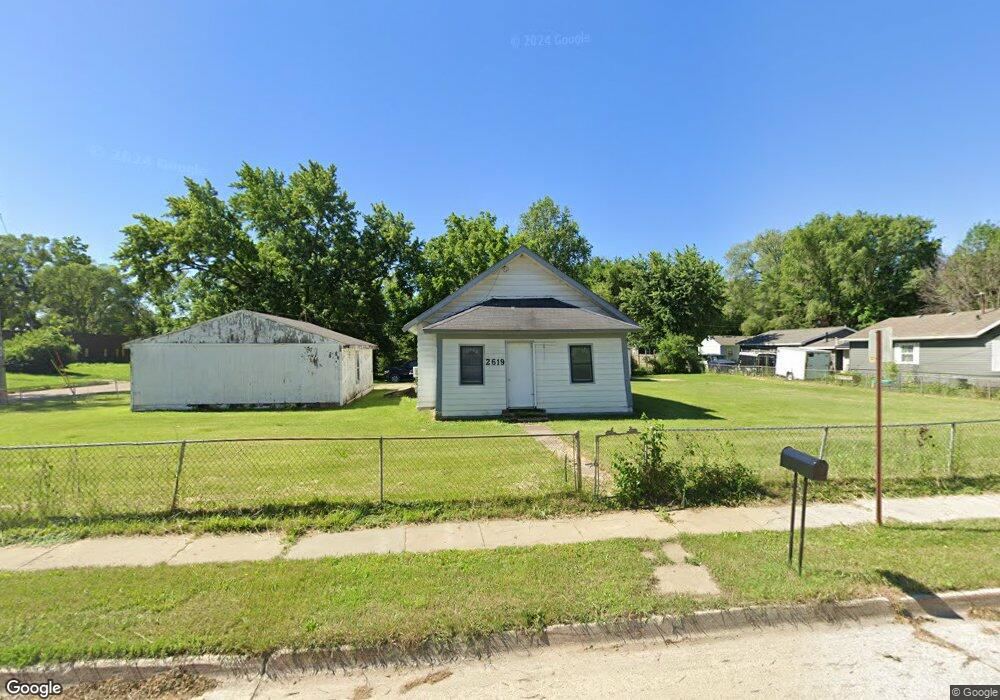
2619 Maury St Des Moines, IA 50317
Chesterfield NeighborhoodEstimated Value: $51,000 - $147,000
2
Beds
1
Bath
816
Sq Ft
$143/Sq Ft
Est. Value
About This Home
This home is located at 2619 Maury St, Des Moines, IA 50317 and is currently estimated at $116,631, approximately $142 per square foot. 2619 Maury St is a home located in Polk County with nearby schools including Willard Elementary School, Hoyt Middle School, and East High School.
Ownership History
Date
Name
Owned For
Owner Type
Purchase Details
Closed on
Apr 1, 2013
Sold by
Grandview Cabinet Shop Inc
Bought by
Dicks Alice
Current Estimated Value
Purchase Details
Closed on
Nov 1, 2008
Sold by
Grandview Cabinet Shop Inc
Bought by
Tietjen Kevin R
Home Financials for this Owner
Home Financials are based on the most recent Mortgage that was taken out on this home.
Original Mortgage
$49,000
Interest Rate
8.25%
Mortgage Type
Seller Take Back
Create a Home Valuation Report for This Property
The Home Valuation Report is an in-depth analysis detailing your home's value as well as a comparison with similar homes in the area
Home Values in the Area
Average Home Value in this Area
Purchase History
| Date | Buyer | Sale Price | Title Company |
|---|---|---|---|
| Dicks Alice | -- | None Available | |
| Tietjen Kevin R | $50,000 | None Available |
Source: Public Records
Mortgage History
| Date | Status | Borrower | Loan Amount |
|---|---|---|---|
| Previous Owner | Tietjen Kevin R | $49,000 |
Source: Public Records
Tax History Compared to Growth
Tax History
| Year | Tax Paid | Tax Assessment Tax Assessment Total Assessment is a certain percentage of the fair market value that is determined by local assessors to be the total taxable value of land and additions on the property. | Land | Improvement |
|---|---|---|---|---|
| 2025 | $1,888 | $110,400 | $13,000 | $97,400 |
| 2024 | $1,888 | $96,000 | $11,300 | $84,700 |
| 2023 | $1,846 | $96,000 | $11,300 | $84,700 |
| 2022 | $1,832 | $78,300 | $9,900 | $68,400 |
| 2021 | $1,712 | $78,300 | $9,900 | $68,400 |
| 2020 | $1,778 | $68,600 | $8,700 | $59,900 |
| 2019 | $1,602 | $68,600 | $8,700 | $59,900 |
| 2018 | $1,586 | $59,600 | $7,500 | $52,100 |
| 2017 | $1,552 | $59,600 | $7,500 | $52,100 |
| 2016 | $1,512 | $57,400 | $7,100 | $50,300 |
| 2015 | $1,512 | $57,400 | $7,100 | $50,300 |
| 2014 | $1,526 | $57,400 | $7,000 | $50,400 |
Source: Public Records
Map
Nearby Homes