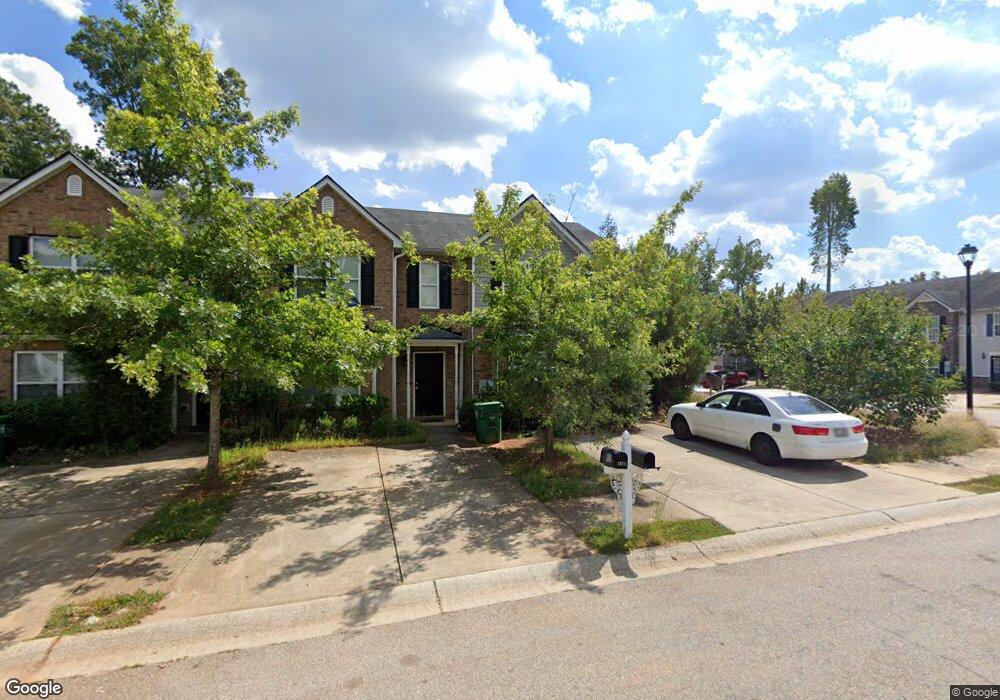
2619 Parrish Ct Unit n/a Lithonia, GA 30038
Estimated Value: $193,722 - $203,000
3
Beds
3
Baths
1,414
Sq Ft
$140/Sq Ft
Est. Value
About This Home
This home is located at 2619 Parrish Ct Unit n/a, Lithonia, GA 30038 and is currently estimated at $197,931, approximately $139 per square foot. 2619 Parrish Ct Unit n/a is a home located in DeKalb County with nearby schools including Fairington Elementary School, Salem Middle School, and Martin Luther King- Jr. High School.
Ownership History
Date
Name
Owned For
Owner Type
Purchase Details
Closed on
May 17, 2022
Sold by
Sibdhannie Eryk
Bought by
Leeward Capital Llc
Current Estimated Value
Home Financials for this Owner
Home Financials are based on the most recent Mortgage that was taken out on this home.
Original Mortgage
$126,750
Outstanding Balance
$120,081
Interest Rate
5.11%
Mortgage Type
Mortgage Modification
Estimated Equity
$77,850
Purchase Details
Closed on
Feb 10, 2010
Sold by
Southern Residential Group Lp
Bought by
Sibdhannie Eric L
Home Financials for this Owner
Home Financials are based on the most recent Mortgage that was taken out on this home.
Original Mortgage
$39,200
Interest Rate
4.97%
Mortgage Type
New Conventional
Purchase Details
Closed on
Oct 23, 2006
Sold by
Dozier Dev Co Llc
Bought by
Southern Residential Group Lp
Home Financials for this Owner
Home Financials are based on the most recent Mortgage that was taken out on this home.
Original Mortgage
$637,500
Interest Rate
6.33%
Create a Home Valuation Report for This Property
The Home Valuation Report is an in-depth analysis detailing your home's value as well as a comparison with similar homes in the area
Home Values in the Area
Average Home Value in this Area
Purchase History
| Date | Buyer | Sale Price | Title Company |
|---|---|---|---|
| Leeward Capital Llc | -- | -- | |
| Sibdhannie Eric L | $49,000 | -- | |
| Southern Residential Group Lp | -- | -- |
Source: Public Records
Mortgage History
| Date | Status | Borrower | Loan Amount |
|---|---|---|---|
| Open | Leeward Capital Llc | $126,750 | |
| Previous Owner | Sibdhannie Eric L | $39,200 | |
| Previous Owner | Southern Residential Group Lp | $637,500 |
Source: Public Records
Tax History Compared to Growth
Tax History
| Year | Tax Paid | Tax Assessment Tax Assessment Total Assessment is a certain percentage of the fair market value that is determined by local assessors to be the total taxable value of land and additions on the property. | Land | Improvement |
|---|---|---|---|---|
| 2025 | $4,154 | $82,920 | $10,000 | $72,920 |
| 2024 | $3,887 | $77,560 | $10,000 | $67,560 |
| 2023 | $3,887 | $74,040 | $10,000 | $64,040 |
| 2022 | $3,201 | $65,240 | $10,000 | $55,240 |
| 2021 | $2,689 | $52,760 | $10,000 | $42,760 |
| 2020 | $2,409 | $46,960 | $10,000 | $36,960 |
| 2019 | $1,828 | $34,040 | $4,800 | $29,240 |
| 2018 | $1,501 | $29,440 | $4,800 | $24,640 |
| 2017 | $1,581 | $28,280 | $4,800 | $23,480 |
| 2016 | $1,341 | $22,800 | $1,080 | $21,720 |
| 2014 | $1,142 | $17,840 | $4,760 | $13,080 |
Source: Public Records
Map
Nearby Homes
- 2626 Parrish Ct
- 2451 Piering Dr
- 2430 Piering Dr
- 2473 Piering Dr
- 11203 Fairington Ridge Cir
- 5301 Fairington Club Dr
- 13304 Fairington Ridge Cir Unit L4
- 13204 Fairington Ridge Cir
- 4101 Fairington Club Dr
- 4103 Fairington Club Dr
- 2539 Piering Dr
- 2543 Piering Dr
- 3203 Fairington Ridge Cir
- 2559 Piering Dr
- 3304 Fairington Village Dr
- 3204 Fairington Village Dr
- 3102 Fairington Village Dr
- 7104 Fairington Ridge Cir
- 8201 Fairington Ridge Cir
- 7302 Fairington Village Dr
- 2619 Parrish Ct
- 2621 Parrish Ct Unit 114
- 2623 Parrish Ct
- 2623 Parrish Ct Unit 115
- 2625 Parrish Ct
- 2625 Parrish Ct Unit 116
- 2450 Piering Dr
- 2627 Parrish Ct
- 2452 Piering Dr
- 2456 Piering Dr
- 2629 Parrish Ct
- 2629 Parrish Ct Unit 118
- 2436 Piering Dr
- 2445 Piering Dr
- 2443 Piering Dr
- 2449 Piering Dr
- 2464 Piering Dr
- 2441 Piering Dr
- 2439 Piering Dr
- 2439 Piering Dr Unit 2439