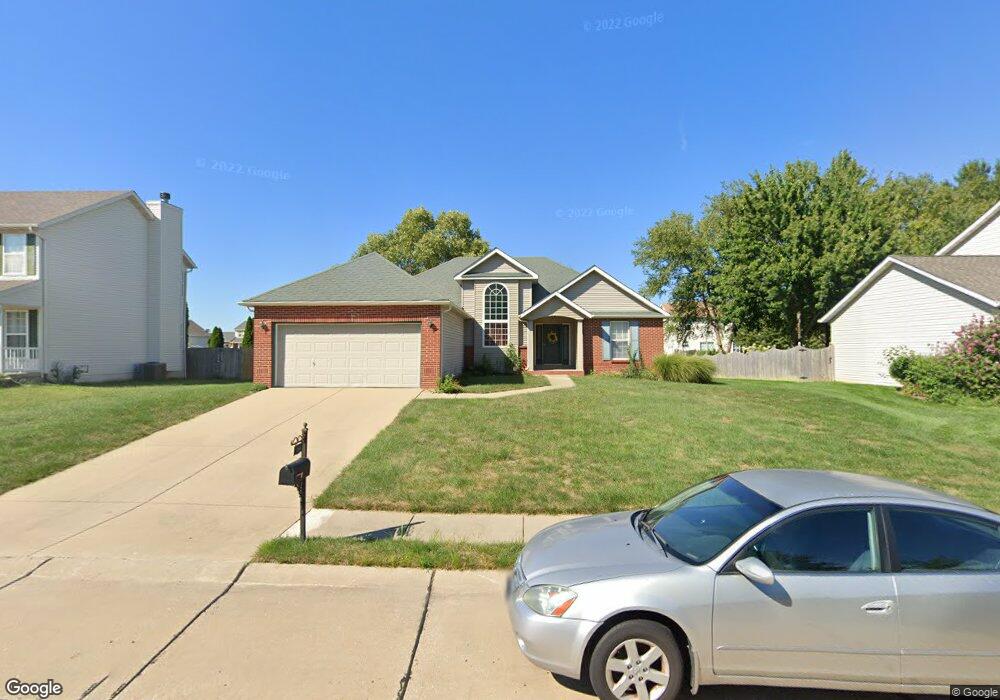
2619 Pipers Ct Belleville, IL 62221
Estimated Value: $268,233 - $354,000
--
Bed
--
Bath
1,586
Sq Ft
$189/Sq Ft
Est. Value
About This Home
This home is located at 2619 Pipers Ct, Belleville, IL 62221 and is currently estimated at $299,058, approximately $188 per square foot. 2619 Pipers Ct is a home located in St. Clair County with nearby schools including Whiteside Elementary School, Whiteside Middle School, and St. Clare Catholic School.
Ownership History
Date
Name
Owned For
Owner Type
Purchase Details
Closed on
May 1, 2001
Sold by
Stimson Construction Inc
Bought by
Holloway Darrell and Holloway Andrea N
Current Estimated Value
Home Financials for this Owner
Home Financials are based on the most recent Mortgage that was taken out on this home.
Original Mortgage
$149,000
Outstanding Balance
$55,307
Interest Rate
6.95%
Mortgage Type
VA
Estimated Equity
$243,751
Create a Home Valuation Report for This Property
The Home Valuation Report is an in-depth analysis detailing your home's value as well as a comparison with similar homes in the area
Home Values in the Area
Average Home Value in this Area
Purchase History
| Date | Buyer | Sale Price | Title Company |
|---|---|---|---|
| Holloway Darrell | $146,500 | Benchmark Title Company |
Source: Public Records
Mortgage History
| Date | Status | Borrower | Loan Amount |
|---|---|---|---|
| Open | Holloway Darrell | $149,000 |
Source: Public Records
Tax History Compared to Growth
Tax History
| Year | Tax Paid | Tax Assessment Tax Assessment Total Assessment is a certain percentage of the fair market value that is determined by local assessors to be the total taxable value of land and additions on the property. | Land | Improvement |
|---|---|---|---|---|
| 2024 | $4,703 | $74,985 | $11,966 | $63,019 |
| 2023 | $4,598 | $71,684 | $11,801 | $59,883 |
| 2022 | $3,965 | $65,286 | $10,748 | $54,538 |
| 2021 | $3,872 | $62,607 | $10,307 | $52,300 |
| 2020 | $3,737 | $58,304 | $9,598 | $48,706 |
| 2019 | $3,437 | $55,862 | $10,481 | $45,381 |
| 2018 | $3,357 | $54,435 | $10,213 | $44,222 |
| 2017 | $3,380 | $52,986 | $9,941 | $43,045 |
| 2016 | $3,364 | $51,159 | $9,598 | $41,561 |
| 2014 | $2,796 | $46,959 | $11,250 | $35,709 |
| 2013 | $3,670 | $46,959 | $11,250 | $35,709 |
Source: Public Records
Map
Nearby Homes
- 651 Glen Mor
- 2652 Cheyenne Wells Dr
- 612 Westfield Ct
- 2605 Cheyenne Wells Dr
- 520 Country Meadow Ln
- Whitney Plan at Greystone Estates
- Franklin Plan at Greystone Estates
- Wright Plan at Greystone Estates
- Jefferson Plan at Greystone Estates
- Lynwood Plan at Greystone Estates
- Carnegie Plan at Greystone Estates
- 2604 Windsor Crest Ct
- 3422 Chippewa Dr
- 714 Oxen Dr
- 2708 Ambridge Dr
- 713 Oxen Dr
- 3416 Navajo Trail
- Brady Plan at Indian Springs - Indian Spring
- Winchester B Plan at Indian Springs - Indian Spring
- Alexandria Plan at Indian Springs - Indian Spring