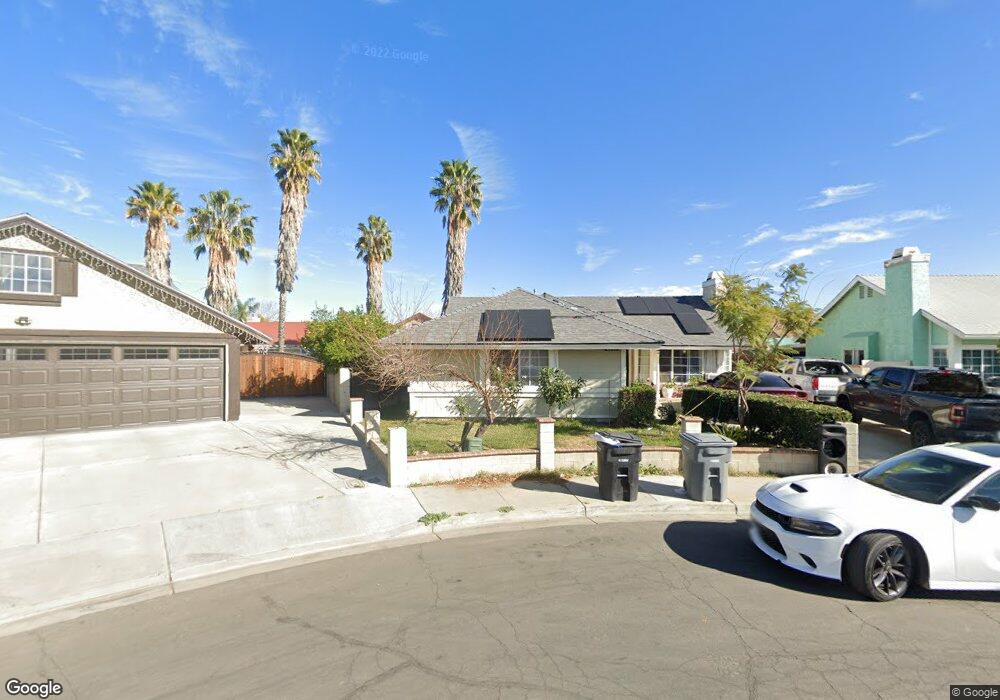
2619 Plaudit Ct Perris, CA 92571
Central Perris NeighborhoodEstimated Value: $434,483 - $475,000
2
Beds
2
Baths
1,035
Sq Ft
$444/Sq Ft
Est. Value
About This Home
This home is located at 2619 Plaudit Ct, Perris, CA 92571 and is currently estimated at $459,871, approximately $444 per square foot. 2619 Plaudit Ct is a home located in Riverside County with nearby schools including Val Verde Elementary School, Lakeside Middle School, and Rancho Verde High School.
Ownership History
Date
Name
Owned For
Owner Type
Purchase Details
Closed on
Feb 23, 2018
Sold by
Cayente Raul and Cayente Maria Carmen Frias De
Bought by
Cayente Jose Raul Frias and Cayente Fernando Frias
Current Estimated Value
Purchase Details
Closed on
Jul 25, 2002
Sold by
Cayente Raul
Bought by
Cayente Raul and Cayente Carmen
Home Financials for this Owner
Home Financials are based on the most recent Mortgage that was taken out on this home.
Original Mortgage
$55,247
Interest Rate
6.6%
Mortgage Type
FHA
Purchase Details
Closed on
Aug 19, 1996
Sold by
Cayente Maria
Bought by
Cayente Raul
Home Financials for this Owner
Home Financials are based on the most recent Mortgage that was taken out on this home.
Original Mortgage
$55,038
Interest Rate
8.23%
Mortgage Type
FHA
Purchase Details
Closed on
Aug 1, 1996
Sold by
Hud
Bought by
Cayente Raul
Home Financials for this Owner
Home Financials are based on the most recent Mortgage that was taken out on this home.
Original Mortgage
$55,038
Interest Rate
8.23%
Mortgage Type
FHA
Purchase Details
Closed on
Aug 25, 1995
Sold by
Chase Fred Gordon and Chase Tina Noel
Bought by
North American Mtg Company
Create a Home Valuation Report for This Property
The Home Valuation Report is an in-depth analysis detailing your home's value as well as a comparison with similar homes in the area
Home Values in the Area
Average Home Value in this Area
Purchase History
| Date | Buyer | Sale Price | Title Company |
|---|---|---|---|
| Cayente Jose Raul Frias | -- | None Available | |
| Cayente Raul | -- | Commonwealth Title | |
| Cayente Raul | -- | Fidelity Title | |
| Cayente Raul | $56,472 | Fidelity Title | |
| North American Mtg Company | $89,815 | American Title Ins Co |
Source: Public Records
Mortgage History
| Date | Status | Borrower | Loan Amount |
|---|---|---|---|
| Closed | Cayente Raul | $55,247 | |
| Closed | Cayente Raul | $55,038 |
Source: Public Records
Tax History
| Year | Tax Paid | Tax Assessment Tax Assessment Total Assessment is a certain percentage of the fair market value that is determined by local assessors to be the total taxable value of land and additions on the property. | Land | Improvement |
|---|---|---|---|---|
| 2025 | $1,297 | $104,198 | $40,696 | $63,502 |
| 2023 | $1,297 | $100,154 | $39,117 | $61,037 |
| 2022 | $1,260 | $98,191 | $38,350 | $59,841 |
| 2021 | $1,251 | $96,267 | $37,599 | $58,668 |
| 2020 | $1,240 | $95,281 | $37,214 | $58,067 |
| 2019 | $1,176 | $93,414 | $36,485 | $56,929 |
| 2018 | $1,160 | $91,583 | $35,771 | $55,812 |
| 2017 | $2,085 | $89,788 | $35,070 | $54,718 |
| 2016 | $2,159 | $88,029 | $34,383 | $53,646 |
| 2015 | $2,145 | $86,708 | $33,867 | $52,841 |
| 2014 | $2,187 | $85,011 | $33,204 | $51,807 |
Source: Public Records
Map
Nearby Homes
- 2607 Ferdinand Ct
- 2536 Slew of Gold Ct
- 49 Bold Venture St
- 0 Redlands Ave Unit SW26063801
- 166 Ambrosia Ct
- 2269 Firebrand Ave
- 2248 Ridge Ct
- 575 Prairie Way
- 716 Periwinkle Ln
- 2036 Cherrytree Dr
- 377 Aurora Dr
- 26625 Placentia Ave
- 705 Fuchsia Ln
- 723 Anthirium Ave
- 507 Coudures Way
- 560 Coudures Way
- 2293 Murrieta Rd
- 763 Anthirium Ave
- 1900 Summertree Dr
- 129 Olivetree Dr
- 2607 Plaudit Ct
- 2629 Plaudit Ct
- 2620 Ferdinand Ct
- 2626 Ferdinand Ct
- 2614 Ferdinand Ct
- 2595 Plaudit Ct
- 2632 Ferdinand Ct
- 2632 Plaudit Ct
- 2640 Ferdinand Ct
- 2583 Plaudit Ct
- 2608 Ferdinand Ct
- 205 Chant St
- 197 Chant St
- 2620 Plaudit Ct
- 2608 Plaudit Ct
- 2630 Plaudit Ct
- 189 Chant St
- 2596 Plaudit Ct
- 2646 Ferdinand Ct
- 181 Chant St
Your Personal Tour Guide
Ask me questions while you tour the home.