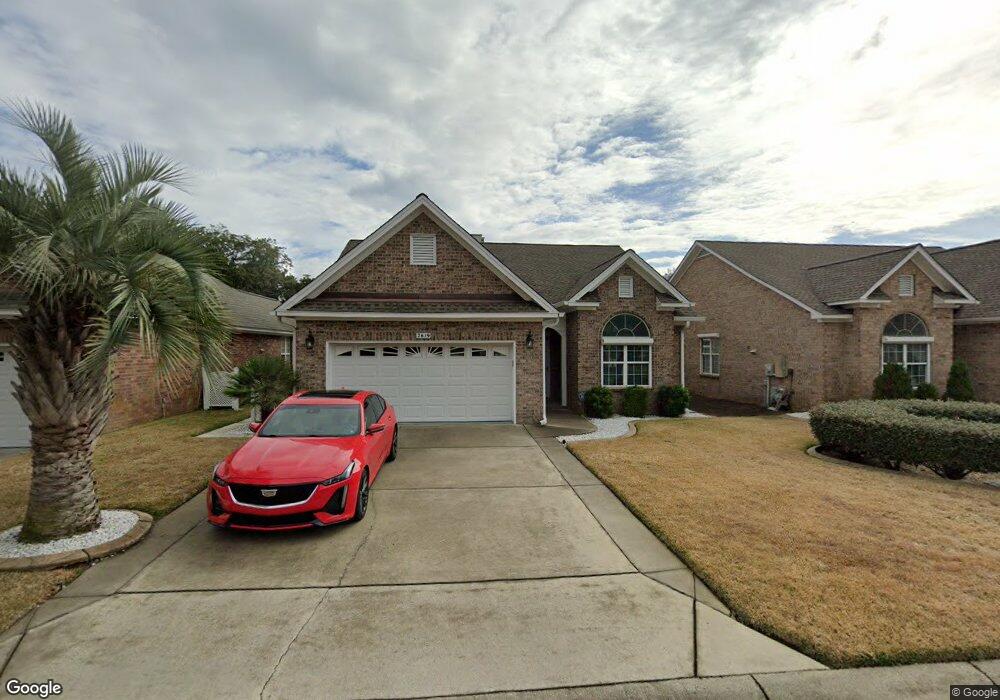
2619 Sarasota St Myrtle Beach, SC 29577
Downtown Myrtle Beach NeighborhoodEstimated Value: $404,000 - $491,000
3
Beds
2
Baths
1,370
Sq Ft
$324/Sq Ft
Est. Value
About This Home
This home is located at 2619 Sarasota St, Myrtle Beach, SC 29577 and is currently estimated at $443,925, approximately $324 per square foot. 2619 Sarasota St is a home located in Horry County with nearby schools including Myrtle Beach Child Development Center, Myrtle Beach Primary School, and Myrtle Beach Elementary School.
Ownership History
Date
Name
Owned For
Owner Type
Purchase Details
Closed on
Dec 17, 2019
Sold by
Buckley Daniel Joseph
Bought by
Buckley Daniel J and Buckley Dawn S
Current Estimated Value
Purchase Details
Closed on
Feb 3, 2012
Sold by
Magrone Paul
Bought by
Buckley Daniel Joseph
Purchase Details
Closed on
Jun 14, 2000
Sold by
Carrera John and Carrera Minnie
Bought by
Magrone Paul and Magrone Lucille
Purchase Details
Closed on
Nov 18, 1998
Sold by
Carrell & Associates Inc
Bought by
Carrera John and Carrera Minnie
Purchase Details
Closed on
Jun 30, 1998
Sold by
Myrtle Beach Farms Company Inc
Bought by
Carrell & Associates Inc
Home Financials for this Owner
Home Financials are based on the most recent Mortgage that was taken out on this home.
Original Mortgage
$138,150
Interest Rate
7.02%
Mortgage Type
Purchase Money Mortgage
Create a Home Valuation Report for This Property
The Home Valuation Report is an in-depth analysis detailing your home's value as well as a comparison with similar homes in the area
Home Values in the Area
Average Home Value in this Area
Purchase History
| Date | Buyer | Sale Price | Title Company |
|---|---|---|---|
| Buckley Daniel J | -- | -- | |
| Buckley Daniel Joseph | $210,000 | -- | |
| Magrone Paul | -- | -- | |
| Carrera John | $172,938 | -- | |
| Carrell & Associates Inc | $33,500 | -- |
Source: Public Records
Mortgage History
| Date | Status | Borrower | Loan Amount |
|---|---|---|---|
| Previous Owner | Carrell & Associates Inc | $138,150 |
Source: Public Records
Tax History Compared to Growth
Tax History
| Year | Tax Paid | Tax Assessment Tax Assessment Total Assessment is a certain percentage of the fair market value that is determined by local assessors to be the total taxable value of land and additions on the property. | Land | Improvement |
|---|---|---|---|---|
| 2024 | $838 | $17,616 | $10,400 | $7,216 |
| 2023 | $838 | $9,904 | $3,640 | $6,264 |
| 2021 | $727 | $9,904 | $3,640 | $6,264 |
| 2020 | $629 | $9,904 | $3,640 | $6,264 |
| 2019 | $605 | $9,904 | $3,640 | $6,264 |
| 2018 | $545 | $8,940 | $2,160 | $6,780 |
| 2017 | $530 | $8,940 | $2,160 | $6,780 |
| 2016 | -- | $8,940 | $2,160 | $6,780 |
| 2015 | $677 | $8,940 | $2,160 | $6,780 |
| 2014 | $610 | $8,940 | $2,160 | $6,780 |
Source: Public Records
Map
Nearby Homes
- 2621 Sarasota St
- 2601 Sand Dunes Dr
- 209 26th Ave S
- 214 26th Ave S
- 2709 S Key Largo Cir
- 2705 S Key Largo Cir Unit MB
- 2600 S Ocean Blvd Unit Palmetto Vista 110
- 2701 S Key Largo Cir
- 2701 Kashton St
- 210 28th Ave S Unit 201
- 207 25th Ave S
- 2741 Kashton Dr
- 2721 S Key Largo Cir Unit Steps to the Atlanti
- 2710 S Ocean Blvd Unit 402
- 2710 S Ocean Blvd Unit 407
- 410 Flounder Way Unit D
- 410 Flounder Way Unit C
- 410 Flounder Way Unit A
- 410 Flounder Way Unit E
- 410 Flounder Way Unit B
- 2619 Sarasota St Unit SEASIDE VILLAGE
- 2617 Sarasota St
- 2615 Sarasota St
- 2623 Sarasota St Unit SEASIDE VILLAGE
- 2623 Sarasota St
- 2605 Yaupon Dr Unit Midway Extension Sec
- 2605 Yaupon Dr
- 2613 Sarasota St
- 2625 Sarasota St Unit Seaside Village
- 2625 Sarasota St
- 2601 Sand Dunes Dr
- 2601 Sand Dunes Dr Unit PORTOFINO VILLAS AT
- 2601 Sand Dunes Dr Unit 1
- 2601 Sand Dunes Dr Unit 2601 SAND DUNES DR U
- 2611 Sarasota St
- 209 26th Ave S Unit Midway Extension Sec
- 2627 Sarasota St Unit MB
- 2629 Sarasota St Unit Seaside Village
- 2629 Sarasota St
- 2607 Yaupon Dr Unit 4